| Map | Pie | Office | Total | D | R | I | Margin | %Margin | Dem | Rep | Ind | Oth. | Dem | Rep | Ind | Other | | | | | | | | | | | | | | | | | | |
|---|
 |  | Senator |
4,279,940 |
2 |
1 |
0 |
964,603 |
22.54% |
38.31% |
60.85% |
0.00% |
0.84% |
1,639,615 |
2,604,218 |
0 |
36,107 |
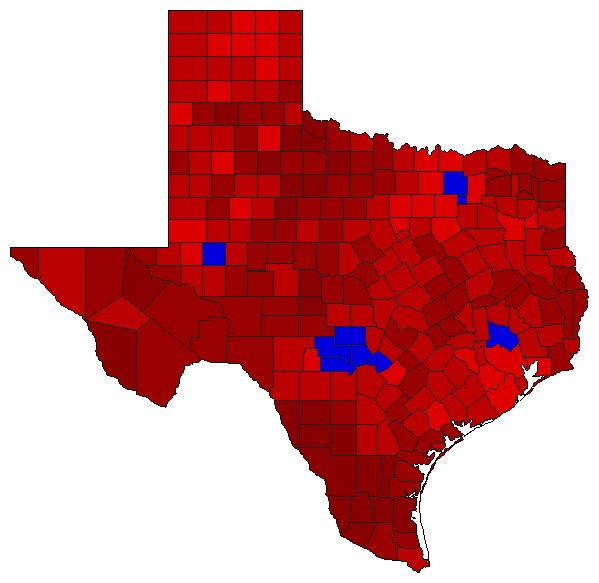
 |  | Governor |
4,396,242 |
2 |
1 |
0 |
334,066 |
7.60% |
45.88% |
53.48% |
0.00% |
0.64% |
2,016,928 |
2,350,994 |
0 |
28,320 |
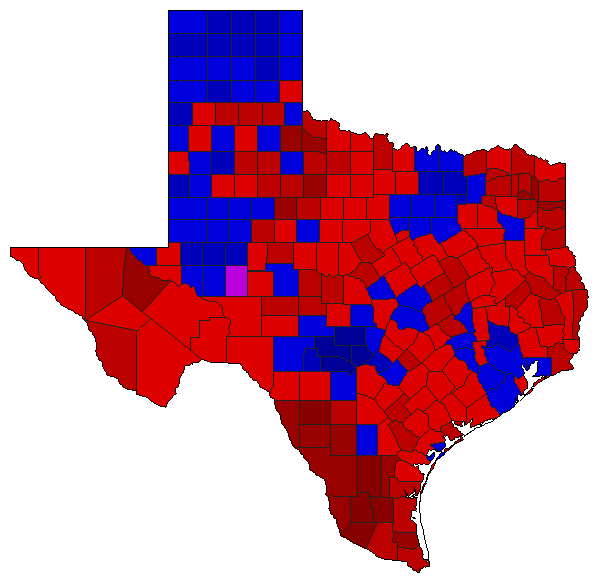
 | | Lt. Governor |
4,280,691 |
1 |
2 |
0 |
982,995 |
22.96% |
61.48% |
38.52% |
0.00% |
0.00% |
2,631,843 |
1,648,848 |
0 |
0 |
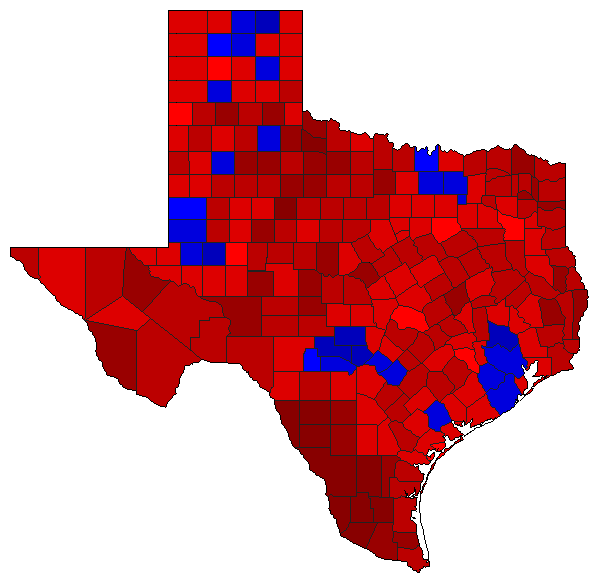
 | | State Treasurer |
4,145,981 |
1 |
2 |
0 |
24,567 |
0.59% |
50.30% |
49.70% |
0.00% |
0.00% |
2,085,274 |
2,060,707 |
0 |
0 |
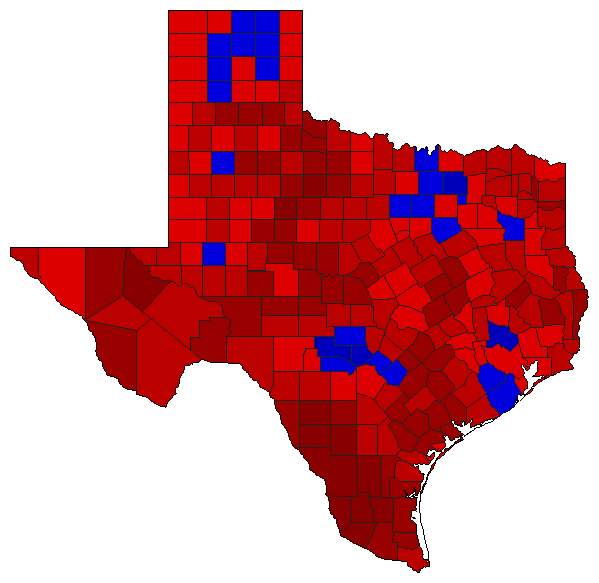
 | | Attorney General |
4,263,161 |
1 |
2 |
0 |
438,986 |
10.30% |
53.70% |
43.40% |
0.00% |
2.89% |
2,289,389 |
1,850,403 |
0 |
123,369 |
 | | Comptroller General |
4,178,615 |
1 |
2 |
0 |
458,075 |
10.96% |
55.48% |
44.52% |
0.00% |
0.00% |
2,318,345 |
1,860,270 |
0 |
0 |
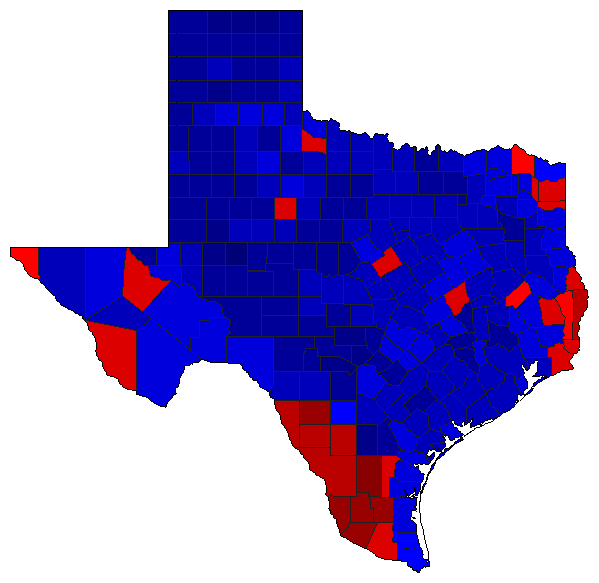 | | Agriculture Commissioner |
4,111,815 |
2 |
1 |
3 |
1,066,595 |
25.94% |
35.99% |
61.93% |
2.09% |
0.00% |
1,479,692 |
2,546,287 |
85,836 |
0 |
|