Note: The Google advertisement links below may advocate political positions that this site does not endorse.
| Map | Pie | Office | Total | D | R | I | Margin | %Margin | Dem | Rep | Ind | Oth. | Dem | Rep | Ind | Other | | | | | | | | | | | | | | | | | | |
|---|
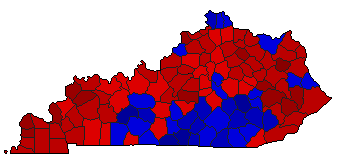
 |  | Governor |
983,797 |
1 |
2 |
3 |
21,378 |
2.17% |
50.88% |
48.71% |
0.40% |
0.00% |
500,605 |
479,227 |
3,965 |
0 |
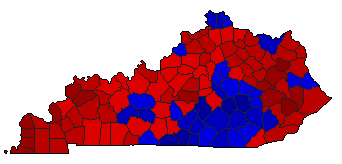
 | | Secretary of State |
924,388 |
1 |
2 |
0 |
132,706 |
14.36% |
57.18% |
42.82% |
0.00% |
0.00% |
528,547 |
395,841 |
0 |
0 |
 | | State Treasurer |
904,163 |
1 |
2 |
0 |
85,439 |
9.45% |
54.72% |
45.28% |
0.00% |
0.00% |
494,801 |
409,362 |
0 |
0 |
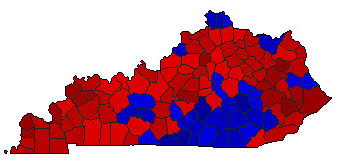
 | | Attorney General |
935,813 |
1 |
2 |
0 |
185,239 |
19.79% |
59.90% |
40.10% |
0.00% |
0.00% |
560,526 |
375,287 |
0 |
0 |
 |  | State Auditor |
886,139 |
1 |
2 |
0 |
94,019 |
10.61% |
55.30% |
44.70% |
0.00% |
0.00% |
490,079 |
396,060 |
0 |
0 |
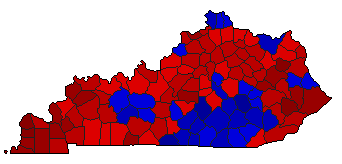 |  | Agriculture Commissioner |
900,452 |
1 |
2 |
0 |
130,596 |
14.50% |
57.25% |
42.75% |
0.00% |
0.00% |
515,524 |
384,928 |
0 |
0 |
|
