| Map | Pie | Year | Total | D | R | I | Margin | %Margin | Dem | Rep | Ind | Oth. | Dem | Rep | Ind | Other | | | | | | | | | | | | | | | | | | |
|---|
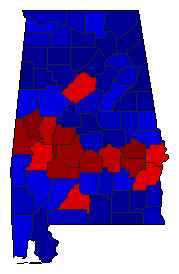
|  | 2022 |
1,407,188 |
2 |
1 |
0 |
504,882 |
35.88% |
32.02% |
67.90% |
0.00% |
0.09% |
450,543 |
955,425 |
0 |
1,220 |
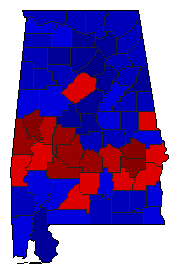
 |  | 2018 |
1,708,437 |
2 |
1 |
0 |
301,580 |
17.65% |
41.14% |
58.79% |
0.00% |
0.07% |
702,858 |
1,004,438 |
0 |
1,141 |
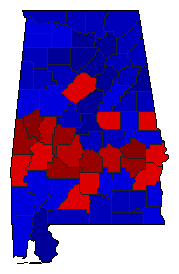
 | | 2014 |
1,167,901 |
2 |
1 |
0 |
198,202 |
16.97% |
41.42% |
58.39% |
0.00% |
0.18% |
483,771 |
681,973 |
0 |
2,157 |
 | | 2010 |
1,476,075 |
2 |
1 |
0 |
262,250 |
17.77% |
41.07% |
58.84% |
0.00% |
0.09% |
606,270 |
868,520 |
0 |
1,285 |
 | | 2006 |
1,231,096 |
2 |
1 |
0 |
76,215 |
6.19% |
46.85% |
53.05% |
0.00% |
0.10% |
576,830 |
653,045 |
0 |
1,221 |
 | | 2002 |
1,326,304 |
2 |
1 |
0 |
265,401 |
20.01% |
38.84% |
58.85% |
0.00% |
2.31% |
515,123 |
780,524 |
0 |
30,657 |
 | | 1998 |
1,278,039 |
2 |
1 |
0 |
6,767 |
0.53% |
49.74% |
50.26% |
0.00% |
0.00% |
635,636 |
642,403 |
0 |
0 |
 | | 1994 |
1,172,047 |
2 |
1 |
0 |
161,773 |
13.80% |
43.10% |
56.90% |
0.00% |
0.00% |
505,137 |
666,910 |
0 |
0 |
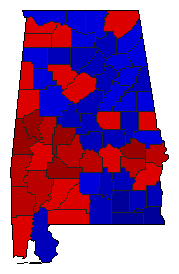
 | | 1990 |
1,128,370 |
1 |
2 |
0 |
325,594 |
28.86% |
64.43% |
35.57% |
0.00% |
0.00% |
726,982 |
401,388 |
0 |
0 |
|
