| Map | Pie | Year | Total | D | R | I | Margin | %Margin | Dem | Rep | Ind | Oth. | Dem | Rep | Ind | Other | | | | | | | | | | | | | | | | | | |
|---|
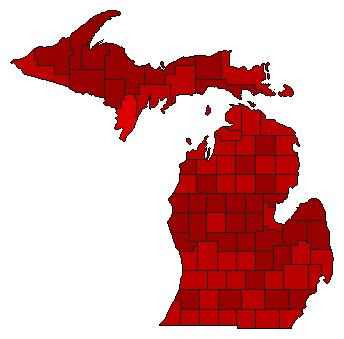
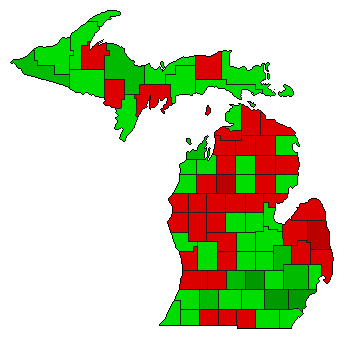 |  | 2022 |
4,311,365 |
2 |
0 |
1 |
861,145 |
19.97% |
40.01% |
0.00% |
59.99% |
0.00% |
1,725,110 |
0 |
2,586,255 |
0 |
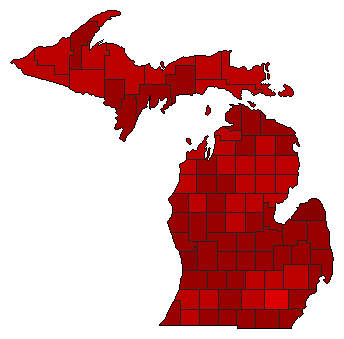
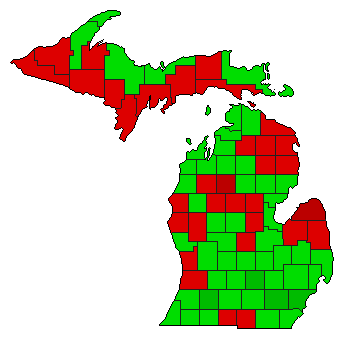 |  | 2018 |
4,198,392 |
2 |
0 |
1 |
495,034 |
11.79% |
44.10% |
0.00% |
55.90% |
0.00% |
1,851,679 |
0 |
2,346,713 |
0 |
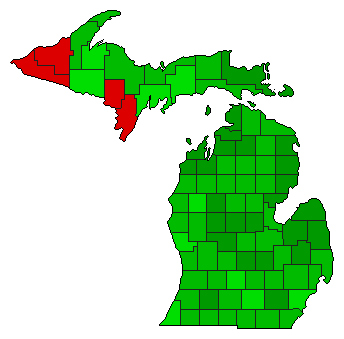
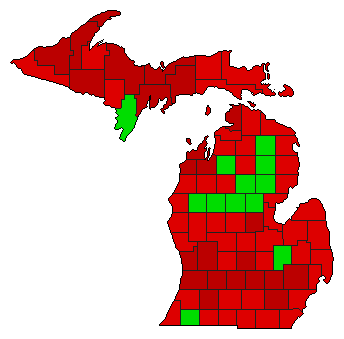 | | 2012 |
4,552,685 |
1 |
0 |
2 |
846,431 |
18.59% |
59.30% |
0.00% |
40.70% |
0.00% |
2,699,558 |
0 |
1,853,127 |
0 |
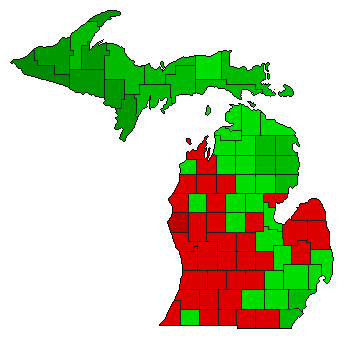
 | | 2008 |
4,797,709 |
2 |
0 |
1 |
1,215,931 |
25.34% |
37.33% |
0.00% |
62.67% |
0.00% |
1,790,889 |
0 |
3,006,820 |
0 |
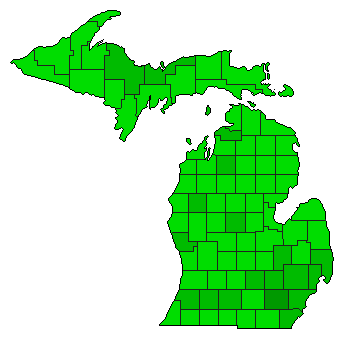
 | | 2000 |
4,002,853 |
1 |
0 |
2 |
1,531,787 |
38.27% |
69.13% |
0.00% |
30.87% |
0.00% |
2,767,320 |
0 |
1,235,533 |
0 |
 | | 1998 |
2,975,535 |
1 |
0 |
2 |
1,256,773 |
42.24% |
71.12% |
0.00% |
28.88% |
0.00% |
2,116,154 |
0 |
859,381 |
0 |
 | | 1976 |
3,387,652 |
2 |
0 |
1 |
933,144 |
27.55% |
36.23% |
0.00% |
63.77% |
0.00% |
1,227,254 |
0 |
2,160,398 |
0 |
 | | 1974 |
2,408,862 |
2 |
0 |
1 |
266,356 |
11.06% |
44.47% |
0.00% |
55.53% |
0.00% |
1,071,253 |
0 |
1,337,609 |
0 |
 | | 1972 |
3,215,611 |
2 |
0 |
1 |
294,163 |
9.15% |
45.43% |
0.00% |
54.57% |
0.00% |
1,460,724 |
0 |
1,754,887 |
0 |
 | | 1970 |
2,495,578 |
2 |
0 |
1 |
338,098 |
13.55% |
43.23% |
0.00% |
56.77% |
0.00% |
1,078,740 |
0 |
1,416,838 |
0 |
|
