Note: The Google advertisement links below may advocate political positions that this site does not endorse.
| Map | Pie | Office | Total | D | R | I | Margin | %Margin | Dem | Rep | Ind | Oth. | Dem | Rep | Ind | Other | | | | | | | | | | | | | | | | | | |
|---|
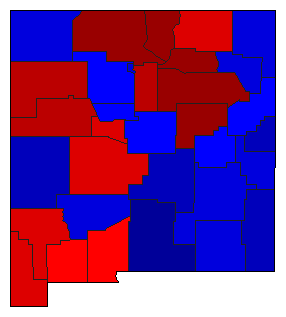
 |  | Governor |
498,703 |
2 |
1 |
0 |
45,193 |
9.06% |
45.47% |
54.53% |
0.00% |
0.00% |
226,755 |
271,948 |
0 |
0 |
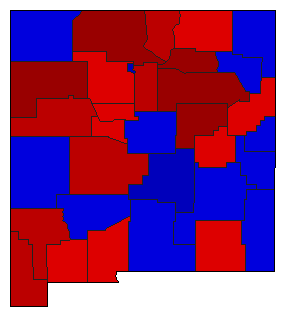
 |  | Secretary of State |
485,054 |
1 |
2 |
0 |
11,131 |
2.29% |
48.35% |
46.06% |
0.00% |
5.59% |
234,546 |
223,415 |
0 |
27,093 |
 | | State Treasurer |
473,019 |
1 |
2 |
0 |
30,571 |
6.46% |
53.23% |
46.77% |
0.00% |
0.00% |
251,795 |
221,224 |
0 |
0 |
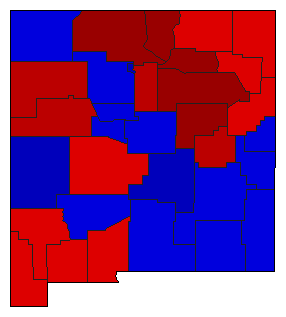 |  | Attorney General |
486,933 |
1 |
2 |
0 |
14,041 |
2.88% |
51.44% |
48.56% |
0.00% |
0.00% |
250,487 |
236,446 |
0 |
0 |
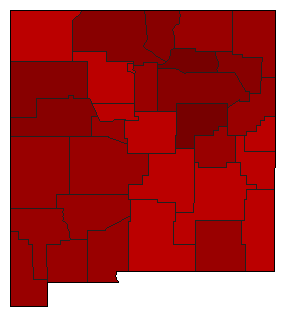 | | State Auditor |
411,193 |
1 |
0 |
2 |
179,535 |
43.66% |
71.83% |
0.00% |
28.17% |
0.00% |
295,364 |
0 |
115,829 |
0 |
|
