| Map | Pie | Office | Total | D | R | I | Margin | %Margin | Dem | Rep | Ind | Oth. | Dem | Rep | Ind | Other | | | | | | | | | | | | | | | | | | |
|---|
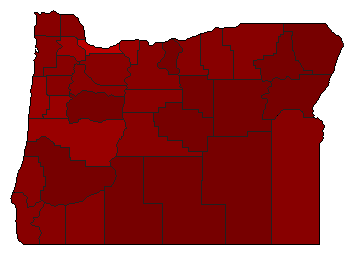
 |  | Senator |
1,117,747 |
1 |
2 |
0 |
304,686 |
27.26% |
61.05% |
33.79% |
0.00% |
5.15% |
682,425 |
377,739 |
0 |
57,583 |
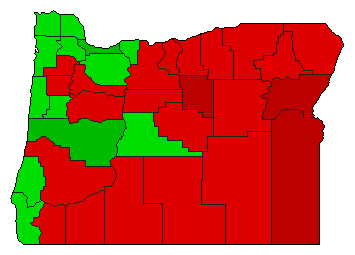
 |  | Governor |
1,113,098 |
1 |
2 |
5 |
383,060 |
34.41% |
64.42% |
30.01% |
0.91% |
4.66% |
717,061 |
334,001 |
10,144 |
51,892 |
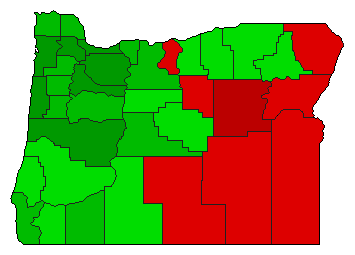
| | | Map | Pie | Initiative | Total Vote | N | | Y | Margin | %Margin | No | | Yes | Oth. | No | | Yes | |
 | | Initiative |
1,113,026 |
1 |
0 |
2 |
682,044 |
61.28% |
80.64% |
0.00% |
19.36% |
0.00% |
897,535 |
0 |
215,491 |
0 |
 | | Initiative |
1,119,453 |
2 |
0 |
1 |
102,927 |
9.19% |
45.40% |
0.00% |
54.60% |
0.00% |
508,263 |
0 |
611,190 |
0 |
 | | Initiative |
1,104,285 |
2 |
0 |
1 |
379,791 |
34.39% |
32.80% |
0.00% |
67.20% |
0.00% |
362,247 |
0 |
742,038 |
0 |
|
