| Map | Pie | Office | Total | D | R | I | Margin | %Margin | Dem | Rep | Ind | Oth. | Dem | Rep | Ind | Other | | | | | | | | | | | | | | | | | | |
|---|
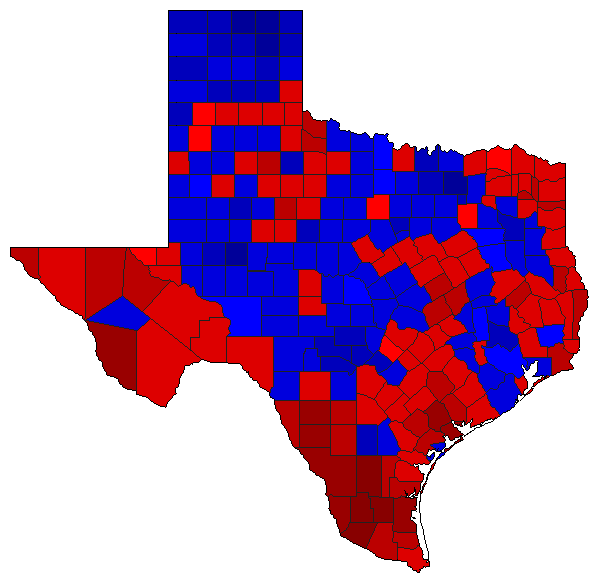
 |  | Governor |
3,738,078 |
2 |
1 |
0 |
1,385,229 |
37.06% |
31.18% |
68.24% |
0.00% |
0.58% |
1,165,592 |
2,550,821 |
0 |
21,665 |
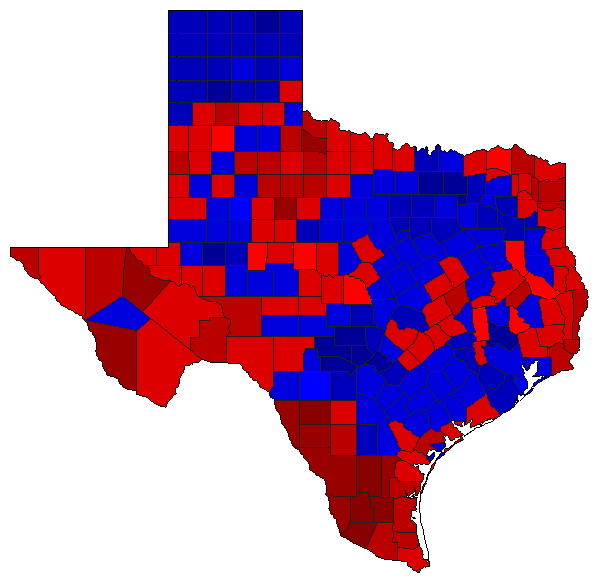
 | | Lt. Governor |
3,714,093 |
2 |
1 |
0 |
68,731 |
1.85% |
48.20% |
50.05% |
0.00% |
1.75% |
1,790,106 |
1,858,837 |
0 |
65,150 |
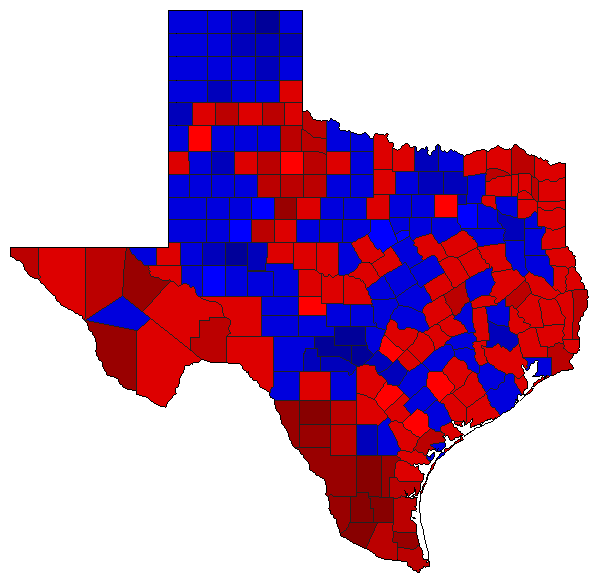
 | | Attorney General |
3,691,443 |
2 |
1 |
0 |
371,749 |
10.07% |
44.18% |
54.26% |
0.00% |
1.56% |
1,631,045 |
2,002,794 |
0 |
57,604 |
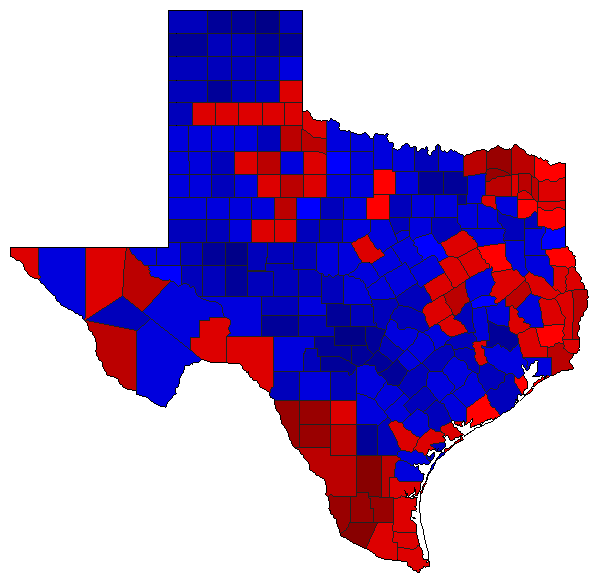
 | | Comptroller General |
3,675,775 |
2 |
1 |
0 |
20,223 |
0.55% |
49.00% |
49.55% |
0.00% |
1.46% |
1,801,008 |
1,821,231 |
0 |
53,536 |
 | | Agriculture Commissioner |
3,590,727 |
2 |
1 |
3 |
510,340 |
14.21% |
42.08% |
56.29% |
1.52% |
0.10% |
1,511,045 |
2,021,385 |
54,669 |
3,628 |
|
