Note: The Google advertisement links below may advocate political positions that this site does not endorse.
| Map | Pie | Office | Total | D | R | I | Margin | %Margin | Dem | Rep | Ind | Oth. | Dem | Rep | Ind | Other | | | | | | | | | | | | | | | | | | |
|---|
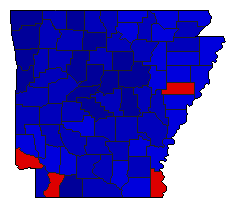
 |  | Senator |
700,644 |
1 |
2 |
0 |
90,008 |
12.85% |
55.07% |
42.23% |
0.00% |
2.70% |
385,878 |
295,870 |
0 |
18,896 |
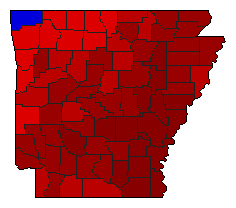
 |  | Governor |
706,011 |
2 |
1 |
3 |
149,066 |
21.11% |
38.66% |
59.77% |
1.57% |
0.00% |
272,923 |
421,989 |
11,099 |
0 |
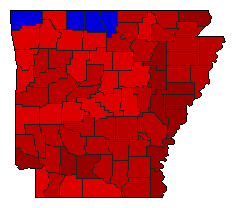
 | | Lt. Governor |
692,160 |
2 |
1 |
0 |
230,700 |
33.33% |
33.33% |
66.67% |
0.00% |
0.00% |
230,730 |
461,430 |
0 |
0 |
 | | Secretary of State |
687,590 |
1 |
2 |
0 |
264,420 |
38.46% |
69.23% |
30.77% |
0.00% |
0.00% |
476,005 |
211,585 |
0 |
0 |
 | | Attorney General |
699,411 |
1 |
2 |
0 |
123,723 |
17.69% |
58.84% |
41.16% |
0.00% |
0.00% |
411,567 |
287,844 |
0 |
0 |
|
