| Map | Pie | Office | Total | D | R | I | Margin | %Margin | Dem | Rep | Ind | Oth. | Dem | Rep | Ind | Other | | | | | | | | | | | | | | | | | | |
|---|
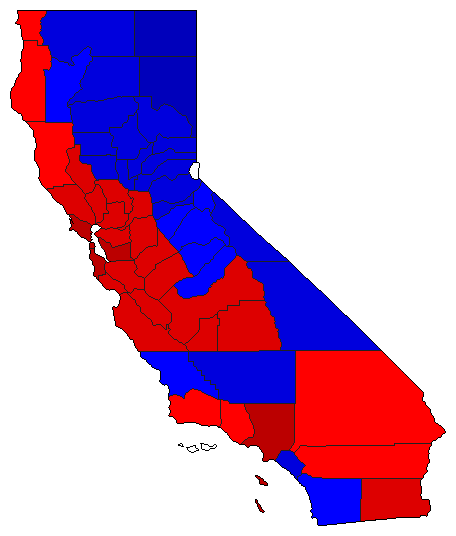
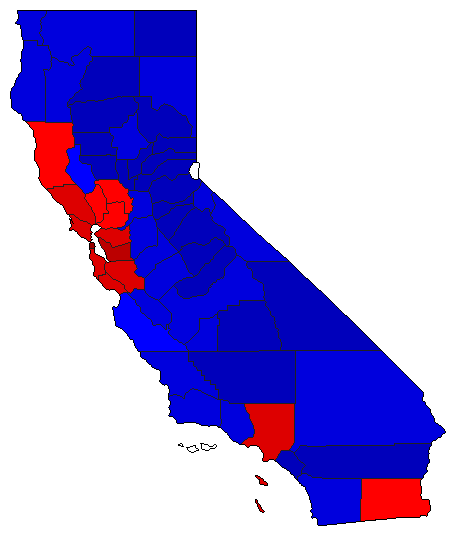
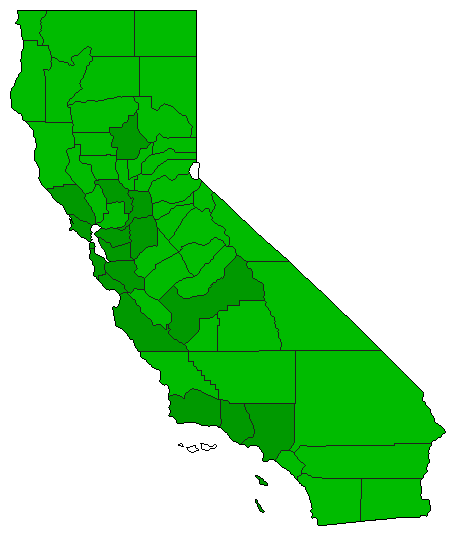
 |  | Senator |
8,311,905 |
1 |
2 |
0 |
834,978 |
10.05% |
53.06% |
43.01% |
0.00% |
3.93% |
4,410,056 |
3,575,078 |
0 |
326,771 |
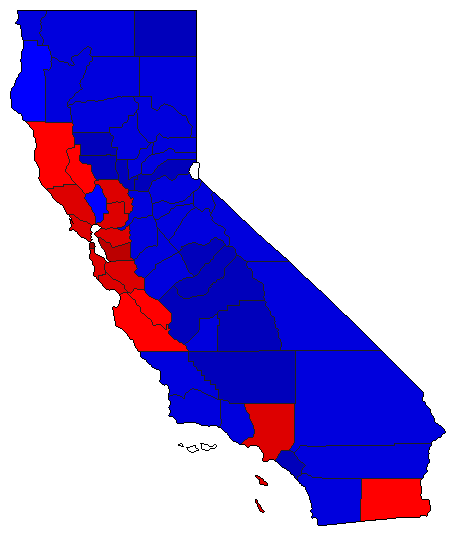
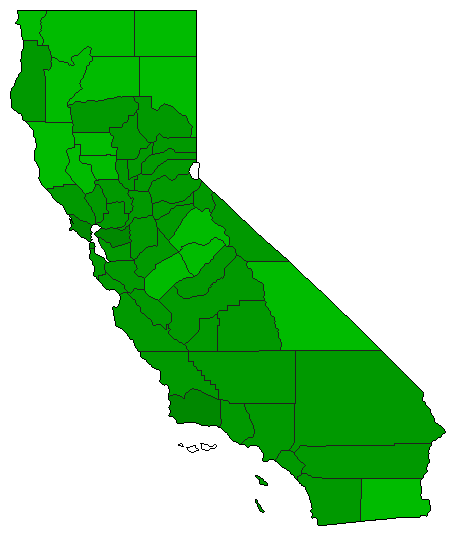
 |  | Governor |
8,381,871 |
1 |
2 |
0 |
1,642,068 |
19.59% |
57.97% |
38.38% |
0.00% |
3.65% |
4,858,817 |
3,216,749 |
0 |
306,305 |
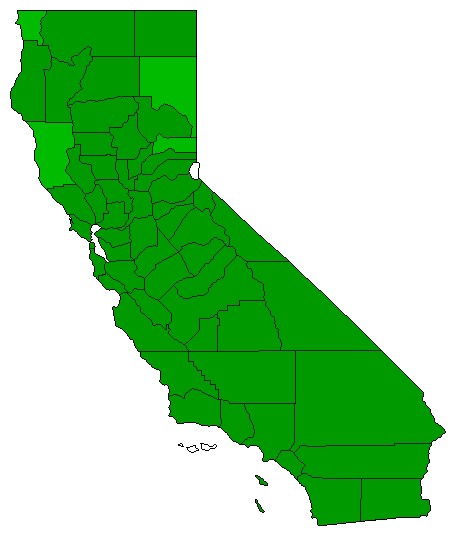
 | | Lt. Governor |
8,143,341 |
1 |
2 |
0 |
1,129,442 |
13.87% |
52.69% |
38.82% |
0.00% |
8.50% |
4,290,473 |
3,161,031 |
0 |
691,837 |
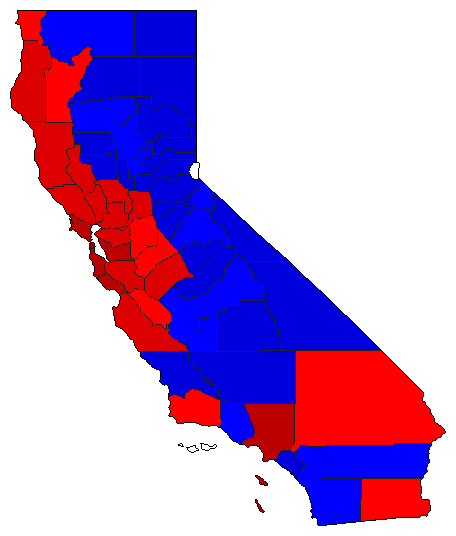
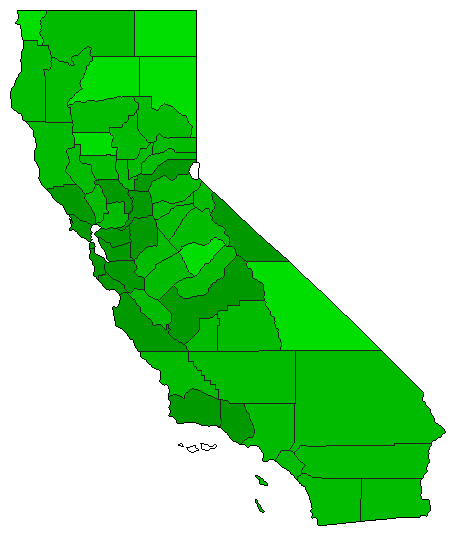
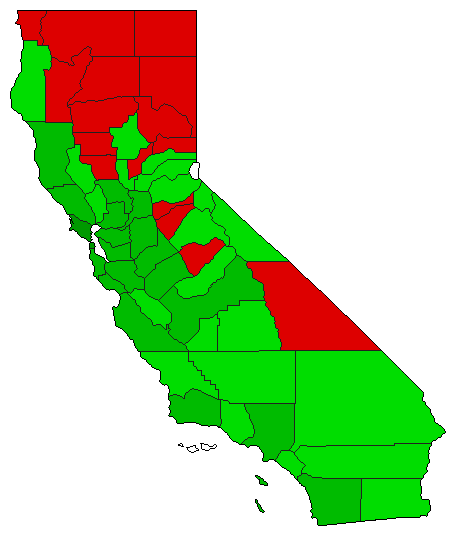
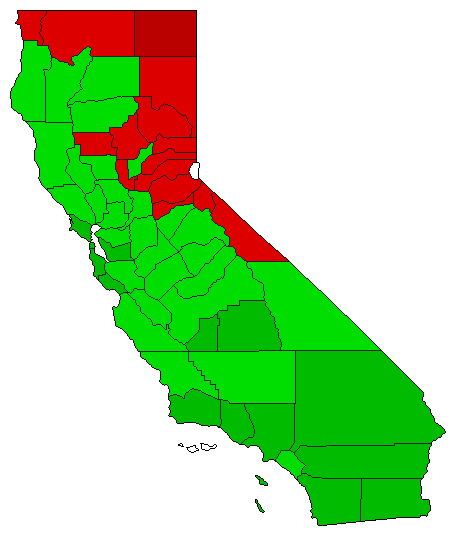
 | | Secretary of State |
8,052,948 |
2 |
1 |
0 |
89,725 |
1.11% |
45.89% |
47.00% |
0.00% |
7.11% |
3,695,344 |
3,785,069 |
0 |
572,535 |
 | | State Treasurer |
7,920,411 |
1 |
2 |
0 |
1,006,308 |
12.71% |
52.60% |
39.90% |
0.00% |
7.50% |
4,166,206 |
3,159,898 |
0 |
594,307 |
 | | Attorney General |
7,997,734 |
1 |
2 |
0 |
729,430 |
9.12% |
51.50% |
42.38% |
0.00% |
6.11% |
4,119,139 |
3,389,709 |
0 |
488,886 |
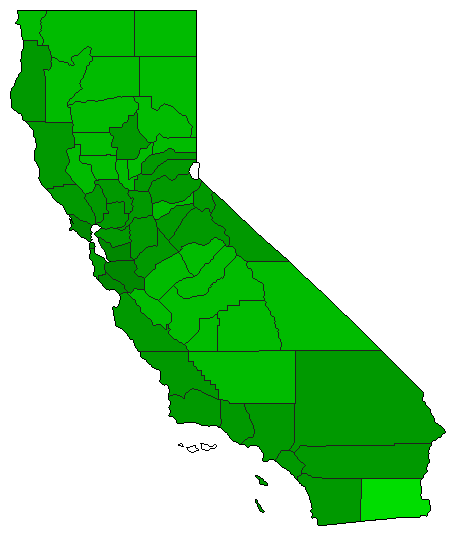
 | | Controller |
8,005,777 |
1 |
2 |
0 |
2,222,816 |
27.77% |
60.91% |
33.14% |
0.00% |
5.95% |
4,875,969 |
2,653,153 |
0 |
476,655 |
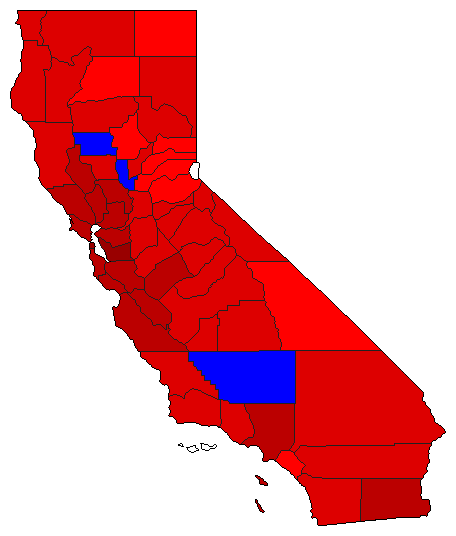
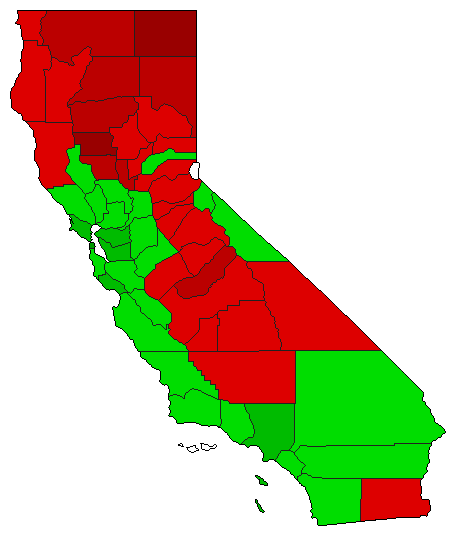
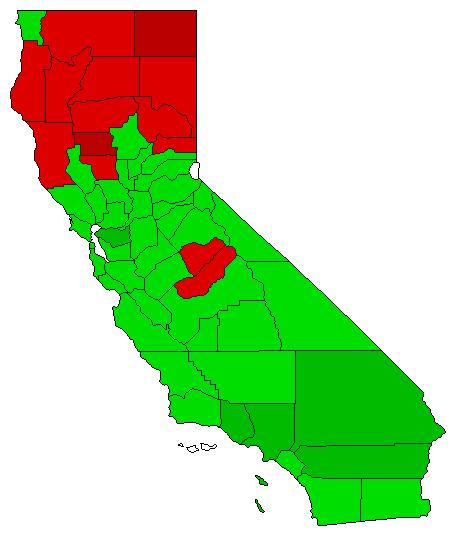
 | | Insurance Commissioner |
8,036,037 |
2 |
1 |
0 |
487,309 |
6.06% |
43.80% |
49.86% |
0.00% |
6.34% |
3,519,453 |
4,006,762 |
0 |
509,822 |
| | | Map | Pie | Initiative | Total Vote | N | | Y | Margin | %Margin | No | | Yes | Oth. | No | | Yes | |
 | | Referendum |
6,168,473 |
2 |
0 |
1 |
3,144,567 |
50.98% |
24.51% |
0.00% |
75.49% |
0.00% |
1,511,953 |
0 |
4,656,520 |
0 |
 | | Referendum |
5,765,606 |
2 |
0 |
1 |
2,987,500 |
51.82% |
24.09% |
0.00% |
75.91% |
0.00% |
1,389,053 |
0 |
4,376,553 |
0 |
 | | Referendum |
6,069,187 |
2 |
0 |
1 |
2,338,347 |
38.53% |
30.74% |
0.00% |
69.26% |
0.00% |
1,865,420 |
0 |
4,203,767 |
0 |
 | | Referendum |
5,897,928 |
2 |
0 |
1 |
2,418,986 |
41.01% |
29.49% |
0.00% |
70.51% |
0.00% |
1,739,471 |
0 |
4,158,457 |
0 |
 | | Initiative |
7,823,727 |
2 |
0 |
1 |
1,953,631 |
24.97% |
37.51% |
0.00% |
62.49% |
0.00% |
2,935,048 |
0 |
4,888,679 |
0 |
 | | Initiative |
7,554,860 |
2 |
0 |
1 |
3,181,716 |
42.11% |
28.94% |
0.00% |
71.06% |
0.00% |
2,186,572 |
0 |
5,368,288 |
0 |
 | | Initiative |
7,323,816 |
2 |
0 |
1 |
3,718,928 |
50.78% |
24.61% |
0.00% |
75.39% |
0.00% |
1,802,444 |
0 |
5,521,372 |
0 |
 | | Initiative |
7,421,009 |
1 |
0 |
2 |
570,327 |
7.69% |
53.84% |
0.00% |
46.16% |
0.00% |
3,995,668 |
0 |
3,425,341 |
0 |
 | | Initiative |
7,812,118 |
2 |
0 |
1 |
1,161,860 |
14.87% |
42.56% |
0.00% |
57.44% |
0.00% |
3,325,129 |
0 |
4,486,989 |
0 |
 | | Initiative |
8,163,868 |
2 |
0 |
1 |
2,021,024 |
24.76% |
37.62% |
0.00% |
62.38% |
0.00% |
3,071,422 |
0 |
5,092,446 |
0 |
 | | Initiative |
7,868,076 |
2 |
0 |
1 |
1,476,838 |
18.77% |
40.61% |
0.00% |
59.39% |
0.00% |
3,195,619 |
0 |
4,672,457 |
0 |
 | | Initiative |
7,599,237 |
1 |
0 |
2 |
968,703 |
12.75% |
56.37% |
0.00% |
43.63% |
0.00% |
4,283,970 |
0 |
3,315,267 |
0 |
 | | Initiative |
7,905,866 |
1 |
0 |
2 |
2,076,120 |
26.26% |
63.13% |
0.00% |
36.87% |
0.00% |
4,990,993 |
0 |
2,914,873 |
0 |
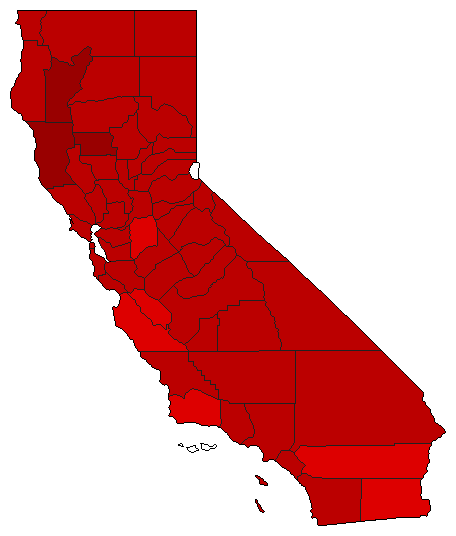
 | | Initiative |
7,777,562 |
1 |
0 |
2 |
3,646,214 |
46.88% |
73.44% |
0.00% |
26.56% |
0.00% |
5,711,888 |
0 |
2,065,674 |
0 |
 | | Initiative |
8,008,134 |
2 |
0 |
1 |
80,118 |
1.00% |
49.50% |
0.00% |
50.50% |
0.00% |
3,964,008 |
0 |
4,044,126 |
0 |
 | | Initiative |
7,307,926 |
2 |
0 |
1 |
488,404 |
6.68% |
46.66% |
0.00% |
53.34% |
0.00% |
3,409,761 |
0 |
3,898,165 |
0 |
 | | Initiative |
5,247,008 |
2 |
0 |
1 |
1,810,870 |
34.51% |
32.74% |
0.00% |
67.26% |
0.00% |
1,718,069 |
0 |
3,528,939 |
0 |
 | | Initiative |
5,380,774 |
2 |
0 |
1 |
1,556,162 |
28.92% |
35.54% |
0.00% |
64.46% |
0.00% |
1,912,306 |
0 |
3,468,468 |
0 |
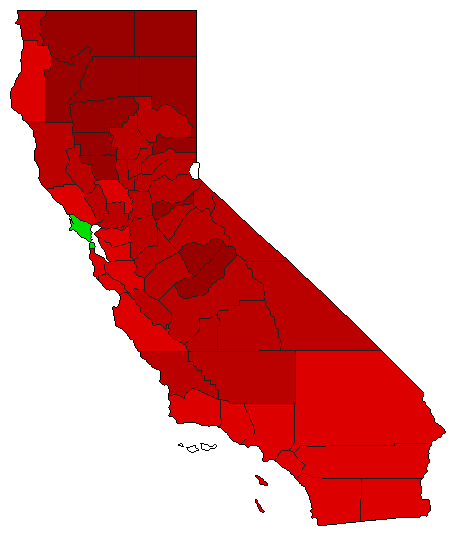
 | | Initiative |
5,276,951 |
2 |
0 |
1 |
3,271,711 |
62.00% |
19.00% |
0.00% |
81.00% |
0.00% |
1,002,620 |
0 |
4,274,331 |
0 |
|
