2000 General Election Results Comparison - Michigan
| Map | Pie | Office | Total | D | R | I | Margin | %Margin | Dem | Rep | Ind | Oth. | Dem | Rep | Ind | Other |
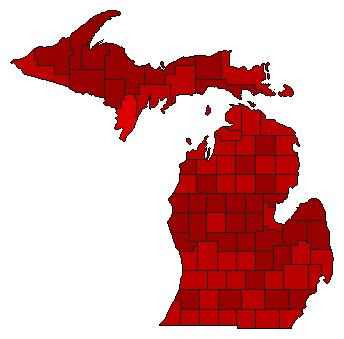
 |  | President | 4,232,711 | 1 | 2 | 3 | 217,279 | 5.13% | 51.28% | 46.14% | 1.99% | 0.59% | 2,170,418 | 1,953,139 | 84,165 | 24,989 |
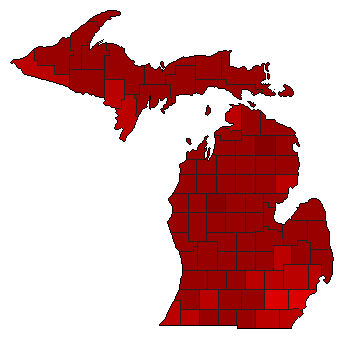
 |  | Senator | 4,167,685 | 1 | 2 | 0 | 67,259 | 1.61% | 49.47% | 47.86% | 0.00% | 2.66% | 2,061,952 | 1,994,693 | 0 | 111,040 |
| Map | Pie | Initiative | Total Vote | N | Y | Margin | %Margin | No | Yes | Oth. | No | Yes | ||||
 | Initiative | 4,002,853 | 1 | 0 | 2 | 1,531,787 | 38.27% | 69.13% | 0.00% | 30.87% | 0.00% | 2,767,320 | 0 | 1,235,533 | 0 | |
 | Initiative | 3,791,511 | 1 | 0 | 2 | 1,306,479 | 34.46% | 67.23% | 0.00% | 32.77% | 0.00% | 2,548,995 | 0 | 1,242,516 | 0 | |
Michigan Results for 2000
Login
© Dave Leip's Atlas of U.S. Elections, LLC 2019 All Rights Reserved
Note: The advertisement links below may advocate political positions that this site does not endorse.
Login
© Dave Leip's Atlas of U.S. Elections, LLC 2019 All Rights Reserved
Note: The advertisement links below may advocate political positions that this site does not endorse.