| Map | Pie | Office | Total | D | R | I | Margin | %Margin | Dem | Rep | Ind | Oth. | Dem | Rep | Ind | Other | | | | | | | | | | | | | | | | | | |
|---|
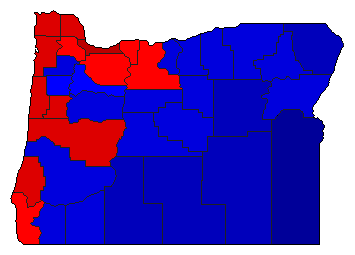
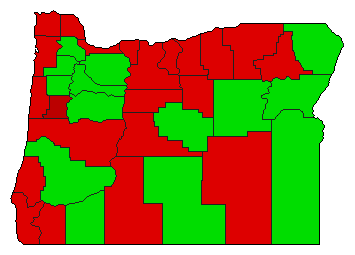
 |  | President |
1,533,968 |
1 |
2 |
3 |
6,765 |
0.44% |
46.96% |
46.52% |
5.04% |
1.48% |
720,342 |
713,577 |
77,357 |
22,692 |
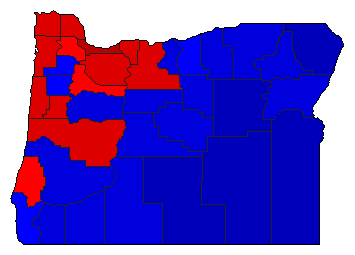
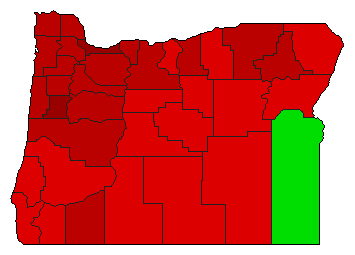
 | | Secretary of State |
1,466,909 |
1 |
2 |
0 |
72,462 |
4.94% |
49.44% |
44.50% |
0.00% |
6.06% |
725,265 |
652,803 |
0 |
88,841 |
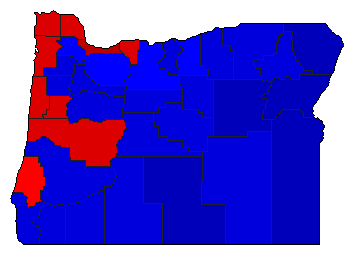
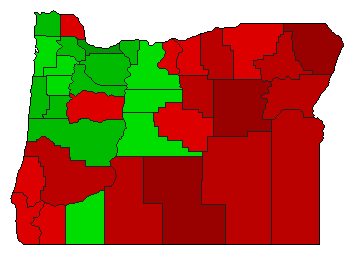
 | | State Treasurer |
1,372,482 |
1 |
2 |
0 |
111,862 |
8.15% |
51.39% |
43.24% |
0.00% |
5.38% |
705,273 |
593,411 |
0 |
73,798 |
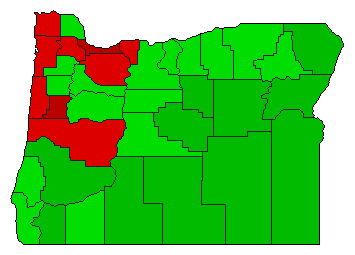
 | | Attorney General |
1,435,093 |
1 |
2 |
0 |
52,722 |
3.67% |
49.86% |
46.19% |
0.00% |
3.94% |
715,602 |
662,880 |
0 |
56,611 |
| | | Map | Pie | Initiative | Total Vote | N | | Y | Margin | %Margin | No | | Yes | Oth. | No | | Yes | |
 | | Initiative |
1,491,263 |
1 |
0 |
2 |
86,119 |
5.77% |
52.89% |
0.00% |
47.11% |
0.00% |
788,691 |
0 |
702,572 |
0 |
 | | Initiative |
1,466,311 |
1 |
0 |
2 |
77,491 |
5.28% |
52.64% |
0.00% |
47.36% |
0.00% |
771,901 |
0 |
694,410 |
0 |
 | | Initiative |
1,477,176 |
1 |
0 |
2 |
447,324 |
30.28% |
65.14% |
0.00% |
34.86% |
0.00% |
962,250 |
0 |
514,926 |
0 |
 | | Initiative |
1,491,922 |
2 |
0 |
1 |
351,930 |
23.59% |
38.21% |
0.00% |
61.79% |
0.00% |
569,996 |
0 |
921,926 |
0 |
|
