Note: The Google advertisement links below may advocate political positions that this site does not endorse.
| Map | Pie | Office | Total | D | R | I | Margin | %Margin | Dem | Rep | Ind | Oth. | Dem | Rep | Ind | Other | | | | | | | | | | | | | | | | | | |
|---|
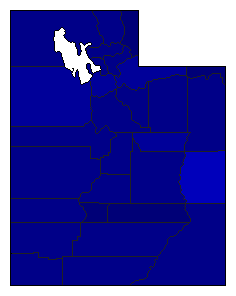
 |  | President |
770,754 |
2 |
1 |
3 |
312,043 |
40.49% |
26.34% |
66.83% |
4.65% |
2.17% |
203,053 |
515,096 |
35,850 |
16,755 |
 |  | Senator |
769,704 |
2 |
1 |
0 |
262,234 |
34.07% |
31.51% |
65.58% |
0.00% |
2.90% |
242,569 |
504,803 |
0 |
22,332 |
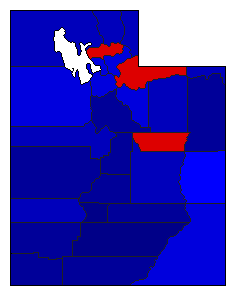
 |  | Governor |
761,806 |
2 |
1 |
3 |
102,858 |
13.50% |
42.27% |
55.77% |
1.97% |
0.00% |
321,979 |
424,837 |
14,990 |
0 |
 | | State Treasurer |
641,847 |
0 |
1 |
0 |
450,675 |
70.22% |
0.00% |
82.94% |
0.00% |
17.06% |
0 |
532,372 |
0 |
109,475 |
 | | Attorney General |
757,944 |
2 |
1 |
0 |
136,305 |
17.98% |
39.54% |
57.52% |
0.00% |
2.94% |
299,683 |
435,988 |
0 |
22,273 |
|
