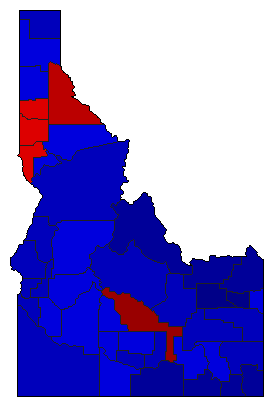
| Map | Pie | Year | Total | D | R | I | Margin | %Margin | Dem | Rep | Ind | Oth. | Dem | Rep | Ind | Other | | | | | | | | | | | | | | | | | | |
|---|
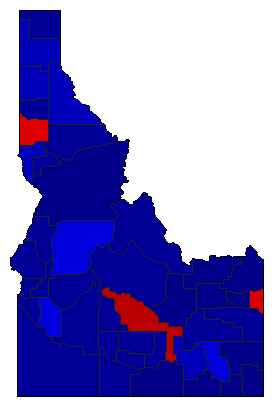
|  | 2022 |
586,984 |
2 |
1 |
0 |
148,174 |
25.24% |
37.38% |
62.62% |
0.00% |
0.00% |
219,405 |
367,579 |
0 |
0 |
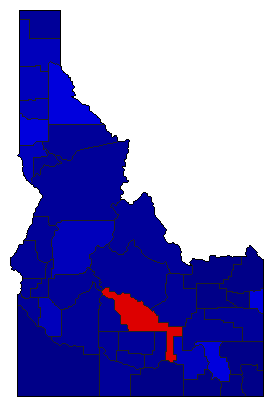
 |  | 2018 |
588,074 |
2 |
1 |
0 |
181,508 |
30.86% |
34.57% |
65.43% |
0.00% |
0.00% |
203,283 |
384,791 |
0 |
0 |
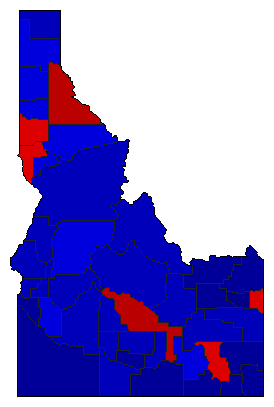
 | | 2014 |
425,753 |
2 |
1 |
0 |
153,591 |
36.08% |
31.96% |
68.04% |
0.00% |
0.00% |
136,081 |
289,672 |
0 |
0 |
 | | 2010 |
367,737 |
0 |
1 |
0 |
367,737 |
100.00% |
0.00% |
100.00% |
0.00% |
0.00% |
0 |
367,737 |
0 |
0 |
 | | 2006 |
433,557 |
2 |
1 |
0 |
101,843 |
23.49% |
38.25% |
61.75% |
0.00% |
0.00% |
165,857 |
267,700 |
0 |
0 |
 | | 2002 |
399,204 |
2 |
1 |
0 |
64,498 |
16.16% |
41.92% |
58.08% |
0.00% |
0.00% |
167,353 |
231,851 |
0 |
0 |
 | | 1998 |
366,929 |
2 |
1 |
0 |
130,697 |
35.62% |
32.19% |
67.81% |
0.00% |
0.00% |
118,116 |
248,813 |
0 |
0 |
 | | 1994 |
397,055 |
2 |
1 |
0 |
48,475 |
12.21% |
43.90% |
56.10% |
0.00% |
0.00% |
174,290 |
222,765 |
0 |
0 |
 | | 1990 |
313,822 |
1 |
2 |
0 |
36,178 |
11.53% |
55.76% |
44.24% |
0.00% |
0.00% |
175,000 |
138,822 |
0 |
0 |
 | | 1986 |
304,424 |
0 |
1 |
0 |
304,424 |
100.00% |
0.00% |
100.00% |
0.00% |
0.00% |
0 |
304,424 |
0 |
0 |
|
