| Map | Pie | Office | Total | D | R | I | Margin | %Margin | Dem | Rep | Ind | Oth. | Dem | Rep | Ind | Other | | | | | | | | | | | | | | | | | | |
|---|
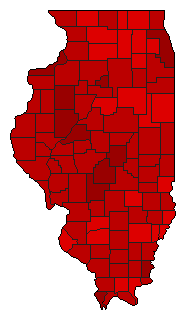
 |  | Senator |
3,486,851 |
1 |
2 |
0 |
778,063 |
22.31% |
60.33% |
38.02% |
0.00% |
1.65% |
2,103,766 |
1,325,703 |
0 |
57,382 |
 |  | Governor |
3,538,891 |
1 |
2 |
0 |
252,080 |
7.12% |
52.19% |
45.07% |
0.00% |
2.74% |
1,847,040 |
1,594,960 |
0 |
96,891 |
 | | Secretary of State |
3,520,683 |
1 |
2 |
0 |
1,338,509 |
38.02% |
67.89% |
29.87% |
0.00% |
2.24% |
2,390,181 |
1,051,672 |
0 |
78,830 |
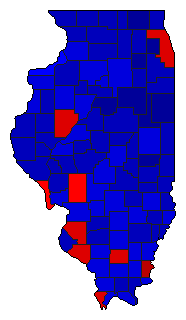
 | | State Treasurer |
3,461,668 |
2 |
1 |
0 |
396,965 |
11.47% |
43.30% |
54.77% |
0.00% |
1.92% |
1,499,055 |
1,896,020 |
0 |
66,593 |
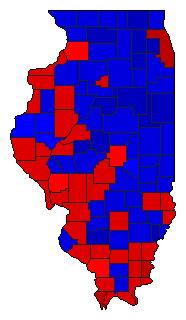
 | | Attorney General |
3,498,901 |
1 |
2 |
0 |
114,946 |
3.29% |
50.39% |
47.10% |
0.00% |
2.51% |
1,762,949 |
1,648,003 |
0 |
87,949 |
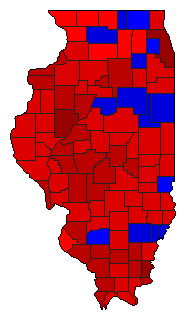
 | | Comptroller General |
3,403,475 |
1 |
2 |
0 |
1,041,441 |
30.60% |
63.18% |
32.58% |
0.00% |
4.23% |
2,150,425 |
1,108,984 |
0 |
144,066 |
|