| Map | Pie | Year | Total | D | R | I | Margin | %Margin | Dem | Rep | Ind | Oth. | Dem | Rep | Ind | Other | | | | | | | | | | | | | | | | | | |
|---|
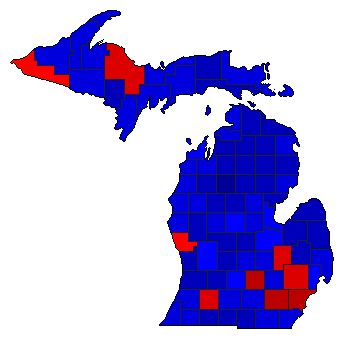
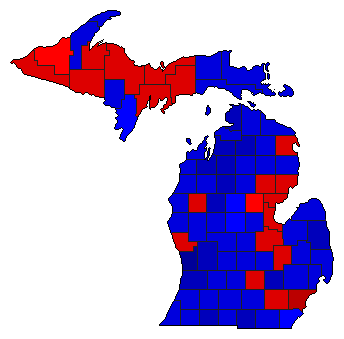
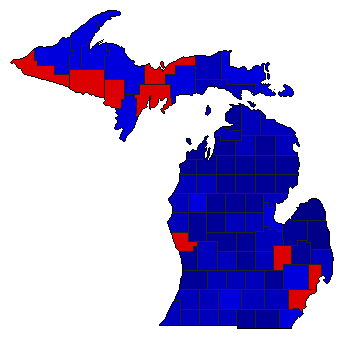
|  | 2022 |
4,381,880 |
1 |
2 |
0 |
376,787 |
8.60% |
53.16% |
44.56% |
0.00% |
2.29% |
2,329,195 |
1,952,408 |
0 |
100,277 |
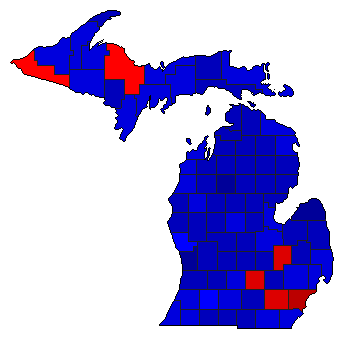
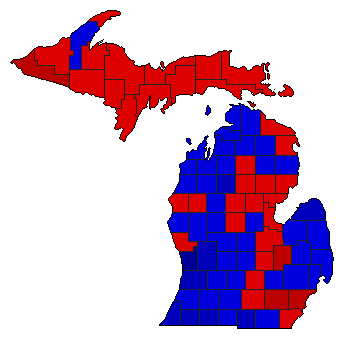
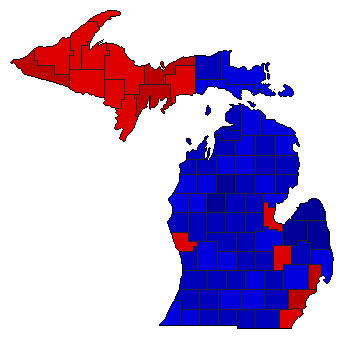
 |  | 2018 |
4,142,044 |
1 |
2 |
4 |
115,000 |
2.78% |
49.04% |
46.26% |
1.69% |
3.02% |
2,031,117 |
1,916,117 |
69,889 |
124,921 |
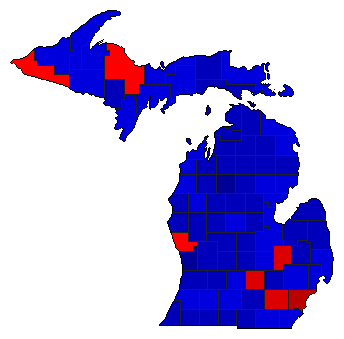
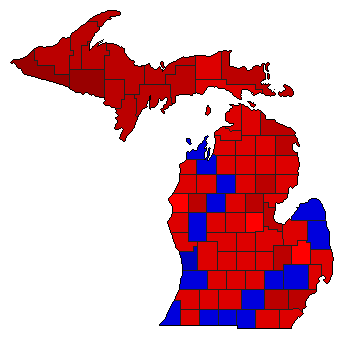
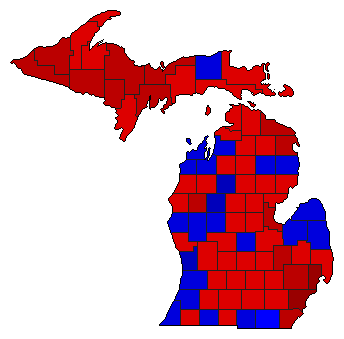
 | | 2014 |
3,077,164 |
2 |
1 |
3 |
243,632 |
7.92% |
44.19% |
52.11% |
1.86% |
1.84% |
1,359,839 |
1,603,471 |
57,345 |
56,509 |
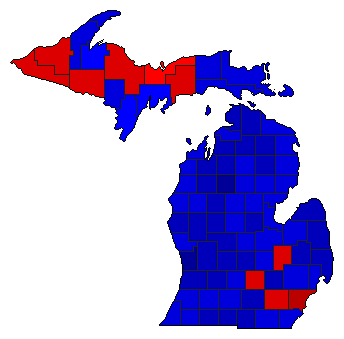
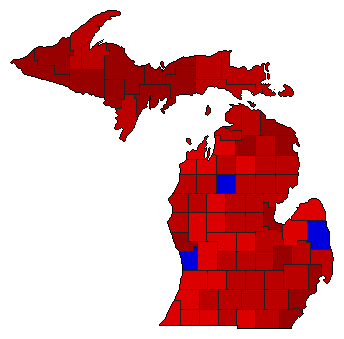
 | | 2010 |
3,136,224 |
2 |
1 |
4 |
285,737 |
9.11% |
43.48% |
52.59% |
1.94% |
2.00% |
1,363,486 |
1,649,223 |
60,778 |
62,737 |
 | | 2006 |
3,690,415 |
2 |
1 |
0 |
380,881 |
10.32% |
43.51% |
53.83% |
0.00% |
2.66% |
1,605,725 |
1,986,606 |
0 |
98,084 |
 | | 2002 |
3,068,012 |
2 |
1 |
0 |
5,200 |
0.17% |
48.69% |
48.86% |
0.00% |
2.45% |
1,493,866 |
1,499,066 |
0 |
75,080 |
 | | 1998 |
2,989,914 |
1 |
2 |
0 |
124,706 |
4.17% |
52.09% |
47.91% |
0.00% |
0.00% |
1,557,310 |
1,432,604 |
0 |
0 |
 | | 1982 |
2,967,565 |
1 |
2 |
3 |
468,309 |
15.78% |
57.52% |
41.74% |
0.73% |
0.00% |
1,707,064 |
1,238,755 |
21,728 |
18 |
 | | 1974 |
2,515,764 |
1 |
2 |
3 |
1,002,491 |
39.85% |
69.14% |
29.29% |
0.83% |
0.73% |
1,739,466 |
736,975 |
20,970 |
18,353 |
 | | 1970 |
2,549,090 |
1 |
2 |
3 |
750,910 |
29.46% |
64.51% |
35.05% |
0.27% |
0.18% |
1,644,348 |
893,438 |
6,789 |
4,515 |
 | | 1962 |
2,660,228 |
1 |
2 |
3 |
118,121 |
4.44% |
52.12% |
47.68% |
0.19% |
0.00% |
1,386,583 |
1,268,462 |
5,179 |
4 |
 | | 1954 |
2,114,857 |
1 |
2 |
3 |
94,415 |
4.46% |
52.19% |
47.73% |
0.07% |
0.00% |
1,103,835 |
1,009,420 |
1,501 |
101 |
 | | 1952 |
2,765,921 |
2 |
1 |
3 |
169,944 |
6.14% |
46.76% |
52.91% |
0.28% |
0.05% |
1,293,426 |
1,463,370 |
7,704 |
1,421 |
|
