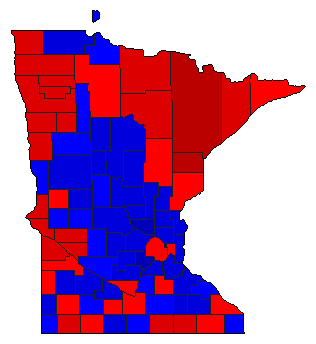
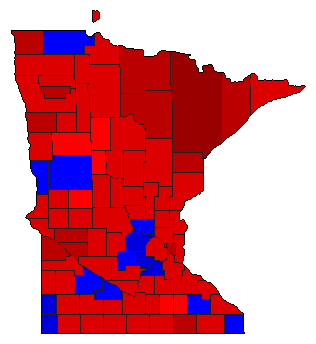
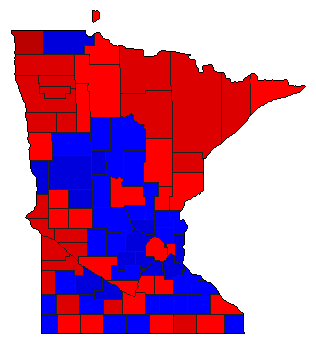
| Map | Pie | Office | Total | D | R | I | Margin | %Margin | Dem | Rep | Ind | Oth. | Dem | Rep | Ind | Other | | | | | | | | | | | | | | | | | | |
|---|
 |  | Senator |
2,255,195 |
2 |
1 |
3 |
49,451 |
2.19% |
47.32% |
49.52% |
2.00% |
1.16% |
1,067,246 |
1,116,697 |
45,139 |
26,113 |
 |  | Governor |
2,252,473 |
2 |
1 |
3 |
178,205 |
7.91% |
36.46% |
44.37% |
16.18% |
2.98% |
821,268 |
999,473 |
364,534 |
67,198 |
 |  | Secretary of State |
2,188,541 |
2 |
1 |
3 |
66,395 |
3.03% |
44.52% |
47.55% |
4.79% |
3.14% |
974,345 |
1,040,740 |
104,799 |
68,657 |
 |  | Attorney General |
2,191,344 |
1 |
2 |
3 |
302,708 |
13.81% |
54.64% |
40.83% |
4.42% |
0.11% |
1,197,362 |
894,654 |
96,817 |
2,511 |
 |  | State Auditor |
2,142,117 |
2 |
1 |
3 |
14,935 |
0.70% |
43.93% |
44.63% |
7.68% |
3.76% |
941,079 |
956,014 |
164,532 |
80,492 |
|