| Map | Pie | Office | Total | D | R | I | Margin | %Margin | Dem | Rep | Ind | Oth. | Dem | Rep | Ind | Other | | | | | | | | | | | | | | | | | | |
|---|
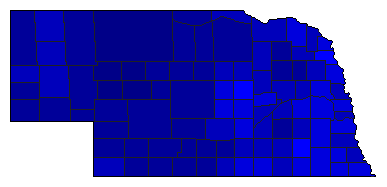
 |  | Senator |
480,217 |
2 |
1 |
4 |
327,148 |
68.13% |
14.64% |
82.76% |
1.05% |
1.55% |
70,290 |
397,438 |
5,066 |
7,423 |
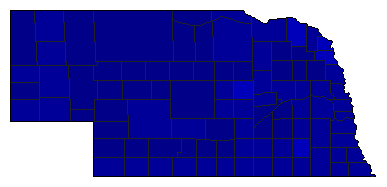
 |  | Governor |
480,991 |
2 |
1 |
0 |
198,001 |
41.17% |
27.52% |
68.68% |
0.00% |
3.80% |
132,348 |
330,349 |
0 |
18,294 |
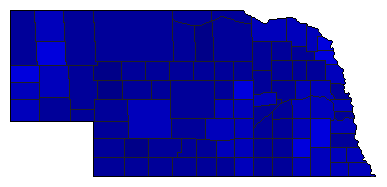
 | | Secretary of State |
441,934 |
2 |
1 |
0 |
142,860 |
32.33% |
29.73% |
62.06% |
0.00% |
8.20% |
131,408 |
274,268 |
0 |
36,258 |
 | | State Treasurer |
418,789 |
0 |
1 |
0 |
213,661 |
51.02% |
0.00% |
75.51% |
0.00% |
24.49% |
0 |
316,225 |
0 |
102,564 |
 |  | Attorney General |
443,499 |
2 |
1 |
0 |
141,847 |
31.98% |
34.01% |
65.99% |
0.00% |
0.00% |
150,826 |
292,673 |
0 |
0 |
 | | State Auditor |
435,482 |
2 |
1 |
0 |
151,391 |
34.76% |
28.96% |
63.73% |
0.00% |
7.31% |
126,132 |
277,523 |
0 |
31,827 |
| | | Map | Pie | Initiative | Total Vote | N | | Y | Margin | %Margin | No | | Yes | Oth. | No | | Yes | |
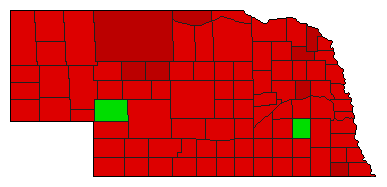 | | Initiative |
431,030 |
1 |
0 |
2 |
57,696 |
13.39% |
56.69% |
0.00% |
43.31% |
0.00% |
244,363 |
0 |
186,667 |
0 |
|
