| Map | Pie | Office | Total | D | R | I | Margin | %Margin | Dem | Rep | Ind | Oth. | Dem | Rep | Ind | Other | | | | | | | | | | | | | | | | | | |
|---|
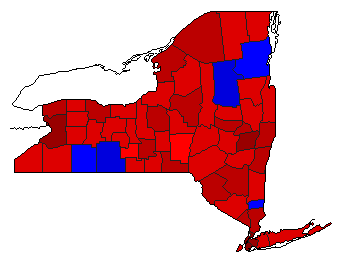
 |  | Governor |
4,579,078 |
2 |
1 |
3 |
728,191 |
15.90% |
33.50% |
49.40% |
14.28% |
2.81% |
1,534,064 |
2,262,255 |
654,016 |
128,743 |
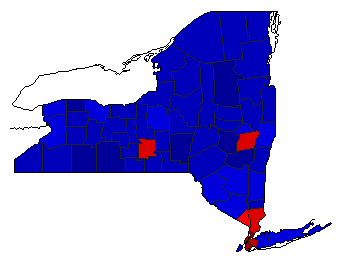
 | | Attorney General |
4,131,437 |
1 |
2 |
0 |
1,509,403 |
36.53% |
66.42% |
29.89% |
0.00% |
3.68% |
2,744,302 |
1,234,899 |
0 |
152,236 |
 | | Comptroller General |
4,157,487 |
1 |
2 |
0 |
162,809 |
3.92% |
50.41% |
46.50% |
0.00% |
3.09% |
2,095,913 |
1,933,104 |
0 |
128,470 |
|
