| Map | Pie | Office | Total | D | R | I | Margin | %Margin | Dem | Rep | Ind | Oth. | Dem | Rep | Ind | Other | | | | | | | | | | | | | | | | | | |
|---|
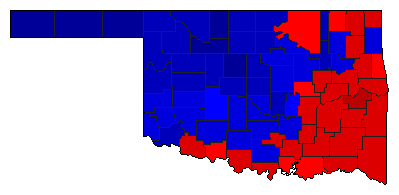
 |  | Senator |
1,018,424 |
2 |
1 |
3 |
213,790 |
20.99% |
36.31% |
57.30% |
6.39% |
0.00% |
369,789 |
583,579 |
65,056 |
0 |
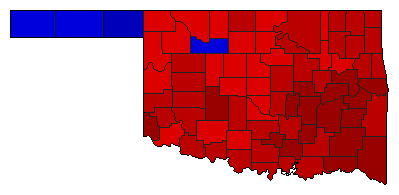
 |  | Governor |
1,035,620 |
1 |
2 |
3 |
6,866 |
0.66% |
43.27% |
42.61% |
14.12% |
0.00% |
448,143 |
441,277 |
146,200 |
0 |
 | | Lt. Governor |
1,028,356 |
2 |
1 |
0 |
184,479 |
17.94% |
38.95% |
56.89% |
0.00% |
4.17% |
400,511 |
584,990 |
0 |
42,855 |
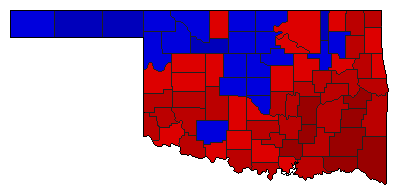
 |  | Attorney General |
1,024,765 |
1 |
2 |
0 |
207,099 |
20.21% |
60.10% |
39.90% |
0.00% |
0.00% |
615,932 |
408,833 |
0 |
0 |
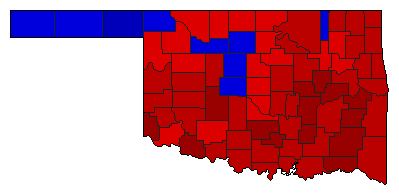
 |  | State Auditor |
1,004,071 |
1 |
2 |
0 |
28,779 |
2.87% |
51.43% |
48.57% |
0.00% |
0.00% |
516,425 |
487,646 |
0 |
0 |
 |  | Insurance Commissioner |
1,009,584 |
1 |
2 |
0 |
164,158 |
16.26% |
58.13% |
41.87% |
0.00% |
0.00% |
586,871 |
422,713 |
0 |
0 |
| | | Map | Pie | Initiative | Total Vote | N | | Y | Margin | %Margin | No | | Yes | Oth. | No | | Yes | |
 | | Initiative |
1,007,187 |
2 |
0 |
1 |
124,747 |
12.39% |
43.81% |
0.00% |
56.19% |
0.00% |
441,220 |
0 |
565,967 |
0 |
|
