Note: The Google advertisement links below may advocate political positions that this site does not endorse.
| Map | Pie | Office | Total | D | R | I | Margin | %Margin | Dem | Rep | Ind | Oth. | Dem | Rep | Ind | Other | | | | | | | | | | | | | | | | | | |
|---|
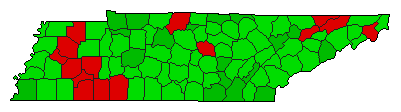
 |  | Senator |
1,642,421 |
2 |
1 |
0 |
163,125 |
9.93% |
44.34% |
54.27% |
0.00% |
1.38% |
728,295 |
891,420 |
0 |
22,706 |
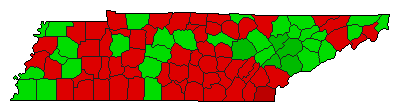
 |  | Governor |
1,653,167 |
1 |
2 |
0 |
50,481 |
3.05% |
50.65% |
47.59% |
0.00% |
1.76% |
837,284 |
786,803 |
0 |
29,080 |
| | | Map | Pie | Initiative | Total Vote | N | | Y | Margin | %Margin | No | | Yes | Oth. | No | | Yes | |
 | | Initiative |
1,554,211 |
2 |
0 |
1 |
234,253 |
15.07% |
42.46% |
0.00% |
57.54% |
0.00% |
659,979 |
0 |
894,232 |
0 |
 | | Initiative |
1,325,969 |
2 |
0 |
1 |
78,899 |
5.95% |
47.02% |
0.00% |
52.98% |
0.00% |
623,535 |
0 |
702,434 |
0 |
|
