| Map | Pie | Office | Total | D | R | I | Margin | %Margin | Dem | Rep | Ind | Oth. | Dem | Rep | Ind | Other | | | | | | | | | | | | | | | | | | |
|---|
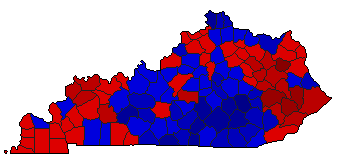
 |  | Governor |
1,083,443 |
2 |
1 |
0 |
109,125 |
10.07% |
44.96% |
55.04% |
0.00% |
0.00% |
487,159 |
596,284 |
0 |
0 |
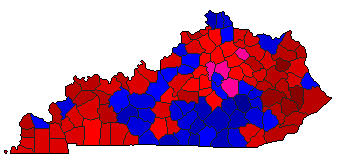
 | | Secretary of State |
1,006,429 |
2 |
1 |
0 |
51,173 |
5.08% |
47.46% |
52.54% |
0.00% |
0.00% |
477,628 |
528,801 |
0 |
0 |
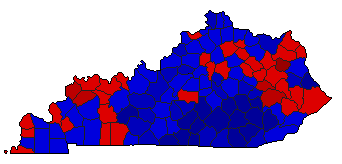
 | | State Treasurer |
1,006,129 |
1 |
2 |
0 |
131,927 |
13.11% |
56.56% |
43.44% |
0.00% |
0.00% |
569,028 |
437,101 |
0 |
0 |
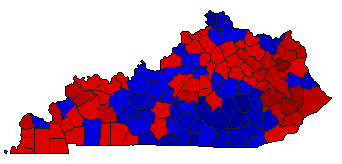
 | | Attorney General |
1,032,191 |
1 |
2 |
3 |
62,387 |
6.04% |
47.72% |
41.67% |
10.61% |
0.00% |
492,540 |
430,153 |
109,498 |
0 |
 | | State Auditor |
1,011,538 |
1 |
2 |
0 |
15,370 |
1.52% |
50.76% |
49.24% |
0.00% |
0.00% |
513,454 |
498,084 |
0 |
0 |
 | | Agriculture Commissioner |
1,046,704 |
2 |
1 |
0 |
109,312 |
10.44% |
44.78% |
55.22% |
0.00% |
0.00% |
468,696 |
578,008 |
0 |
0 |
|
