| Map | Pie | Office | Total | D | R | I | Margin | %Margin | Dem | Rep | Ind | Oth. | Dem | Rep | Ind | Other | | | | | | | | | | | | | | | | | | |
|---|
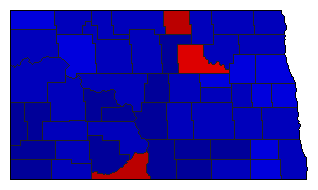
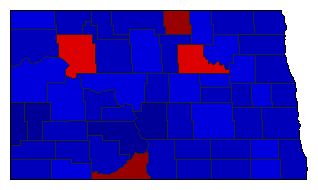
 |  | President |
312,833 |
2 |
1 |
- |
85,599 |
27.36% |
35.50% |
62.86% |
0.00% |
1.64% |
111,052 |
196,651 |
0 |
5,130 |
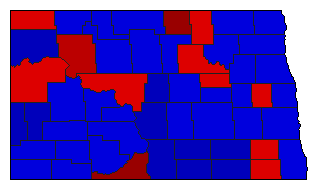
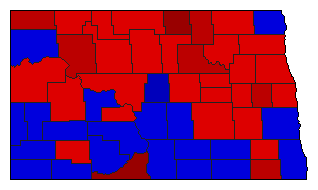
 |  | Senator |
310,696 |
1 |
2 |
0 |
113,590 |
36.56% |
68.28% |
31.72% |
0.00% |
0.00% |
212,143 |
98,553 |
0 |
0 |
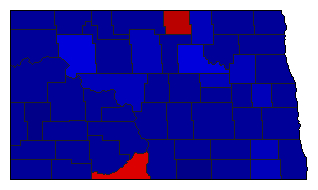
 |  | Governor |
309,873 |
2 |
1 |
3 |
135,926 |
43.87% |
27.39% |
71.26% |
1.35% |
0.00% |
84,877 |
220,803 |
4,193 |
0 |
 | | Secretary of State |
296,324 |
2 |
1 |
0 |
89,852 |
30.32% |
34.84% |
65.16% |
0.00% |
0.00% |
103,236 |
193,088 |
0 |
0 |
 | | State Treasurer |
294,236 |
2 |
1 |
0 |
37,282 |
12.67% |
43.66% |
56.34% |
0.00% |
0.00% |
128,477 |
165,759 |
0 |
0 |
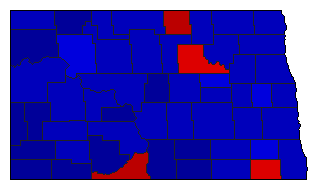
 | | Attorney General |
301,395 |
2 |
1 |
0 |
135,859 |
45.08% |
27.46% |
72.54% |
0.00% |
0.00% |
82,768 |
218,627 |
0 |
0 |
 | | State Auditor |
294,002 |
2 |
1 |
0 |
84,288 |
28.67% |
35.67% |
64.33% |
0.00% |
0.00% |
104,857 |
189,145 |
0 |
0 |
 | | Insurance Commissioner |
295,106 |
2 |
1 |
0 |
84,846 |
28.75% |
35.62% |
64.38% |
0.00% |
0.00% |
105,130 |
189,976 |
0 |
0 |
 |  | Agriculture Commissioner |
297,956 |
1 |
2 |
0 |
1,878 |
0.63% |
50.32% |
49.68% |
0.00% |
0.00% |
149,917 |
148,039 |
0 |
0 |
| | | Map | Pie | Initiative | Total Vote | N | | Y | Margin | %Margin | No | | Yes | Oth. | No | | Yes | |
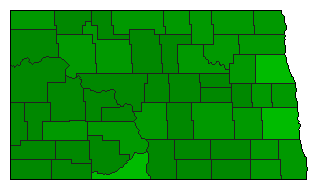 | | Referendum |
305,288 |
2 |
0 |
1 |
141,856 |
46.47% |
26.77% |
0.00% |
73.23% |
0.00% |
81,716 |
0 |
223,572 |
0 |
|
