| Map | Pie | Office | Total | D | R | I | Margin | %Margin | Dem | Rep | Ind | Oth. | Dem | Rep | Ind | Other | | | | | | | | | | | | | | | | | | |
|---|
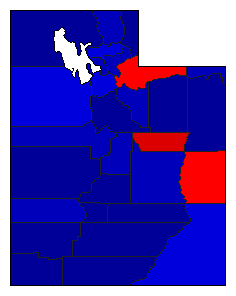
 |  | President |
927,844 |
2 |
1 |
- |
422,543 |
45.54% |
26.00% |
71.54% |
0.00% |
2.47% |
241,199 |
663,742 |
0 |
22,903 |
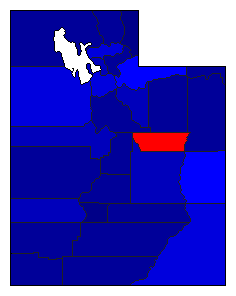
 |  | Senator |
911,726 |
2 |
1 |
0 |
367,685 |
40.33% |
28.40% |
68.73% |
0.00% |
2.87% |
258,955 |
626,640 |
0 |
26,131 |
 |  | Governor |
919,960 |
2 |
1 |
0 |
150,831 |
16.40% |
41.35% |
57.74% |
0.00% |
0.91% |
380,359 |
531,190 |
0 |
8,411 |
 | | State Treasurer |
863,413 |
2 |
1 |
0 |
244,343 |
28.30% |
33.09% |
61.39% |
0.00% |
5.52% |
285,687 |
530,030 |
0 |
47,696 |
 | | Attorney General |
886,415 |
2 |
1 |
0 |
356,573 |
40.23% |
28.30% |
68.52% |
0.00% |
3.18% |
250,820 |
607,393 |
0 |
28,202 |
 | | State Auditor |
872,416 |
2 |
1 |
0 |
297,704 |
34.12% |
28.54% |
62.66% |
0.00% |
8.80% |
248,960 |
546,664 |
0 |
76,792 |
| | | Map | Pie | Initiative | Total Vote | N | | Y | Margin | %Margin | No | | Yes | Oth. | No | | Yes | |
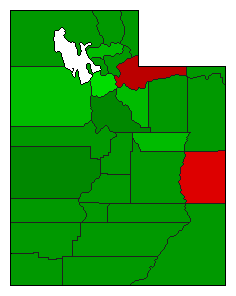
 | | Referendum |
900,785 |
2 |
0 |
1 |
285,809 |
31.73% |
34.14% |
0.00% |
65.86% |
0.00% |
307,488 |
0 |
593,297 |
0 |
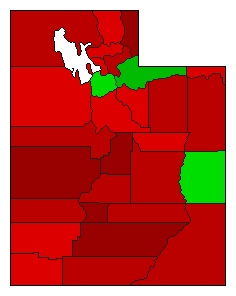
 | | Initiative |
855,791 |
1 |
0 |
2 |
83,317 |
9.74% |
54.87% |
0.00% |
45.13% |
0.00% |
469,554 |
0 |
386,237 |
0 |
|