| Map | Pie | Year | Total | D | R | I | Margin | %Margin | Dem | Rep | Ind | Oth. | Dem | Rep | Ind | Other | | | | | | | | | | | | | | | | | | |
|---|
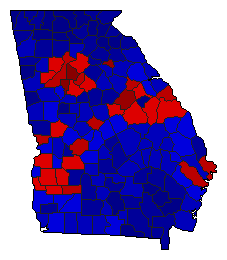
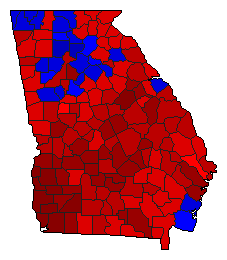
|  | 2022 |
3,910,047 |
2 |
1 |
0 |
361,319 |
9.24% |
43.99% |
53.23% |
0.00% |
2.78% |
1,719,922 |
2,081,241 |
0 |
108,884 |
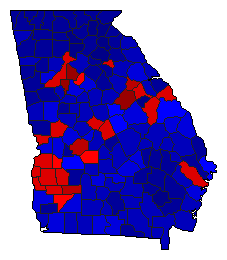
 |  | 2018 |
3,883,594 |
2 |
1 |
3 |
16,278 |
0.42% |
48.67% |
49.09% |
2.23% |
0.00% |
1,890,310 |
1,906,588 |
86,696 |
0 |
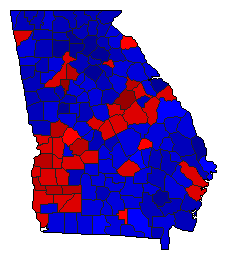
 | | 2014 |
2,527,655 |
2 |
1 |
0 |
377,453 |
14.93% |
42.53% |
57.47% |
0.00% |
0.00% |
1,075,101 |
1,452,554 |
0 |
0 |
 | | 2010 |
2,552,722 |
2 |
1 |
0 |
433,777 |
16.99% |
39.43% |
56.42% |
0.00% |
4.16% |
1,006,411 |
1,440,188 |
0 |
106,123 |
 | | 2006 |
2,063,298 |
2 |
1 |
0 |
253,804 |
12.30% |
41.80% |
54.10% |
0.00% |
4.10% |
862,412 |
1,116,216 |
0 |
84,670 |
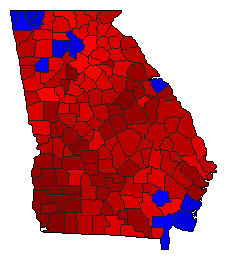 | | 2002 |
2,004,840 |
1 |
2 |
0 |
507,895 |
25.33% |
61.11% |
35.78% |
0.00% |
3.11% |
1,225,232 |
717,337 |
0 |
62,271 |
 | | 1998 |
1,738,127 |
1 |
2 |
0 |
279,964 |
16.11% |
56.61% |
40.50% |
0.00% |
2.89% |
983,905 |
703,941 |
0 |
50,281 |
 | | 1994 |
1,485,671 |
1 |
2 |
0 |
598,185 |
40.26% |
70.13% |
29.87% |
0.00% |
0.00% |
1,041,928 |
443,743 |
0 |
0 |
 | | 1990 |
1,061,341 |
1 |
0 |
0 |
1,061,341 |
100.00% |
100.00% |
0.00% |
0.00% |
0.00% |
1,061,341 |
0 |
0 |
0 |
|
