| Map | Pie | Office | Total | D | R | I | Margin | %Margin | Dem | Rep | Ind | Oth. | Dem | Rep | Ind | Other | | | | | | | | | | | | | | | | | | |
|---|
 |  | Senator |
2,165,490 |
1 |
2 |
0 |
839,206 |
38.75% |
69.30% |
30.55% |
0.00% |
0.15% |
1,500,738 |
661,532 |
0 |
3,220 |
 |  | Governor |
2,219,779 |
1 |
2 |
3 |
450,642 |
20.30% |
55.64% |
35.33% |
6.97% |
2.06% |
1,234,984 |
784,342 |
154,628 |
45,825 |
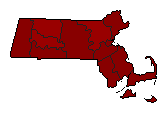 |  | Secretary of State |
1,997,860 |
1 |
0 |
0 |
1,285,043 |
64.32% |
82.02% |
0.00% |
0.00% |
17.98% |
1,638,594 |
0 |
0 |
359,266 |
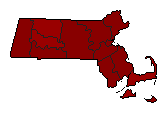 |  | State Treasurer |
1,972,517 |
1 |
0 |
0 |
1,320,397 |
66.94% |
83.35% |
0.00% |
0.00% |
16.65% |
1,644,162 |
0 |
0 |
328,355 |
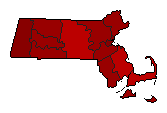 |  | Attorney General |
2,122,810 |
1 |
2 |
0 |
972,194 |
45.80% |
72.86% |
27.06% |
0.00% |
0.09% |
1,546,582 |
574,388 |
0 |
1,840 |
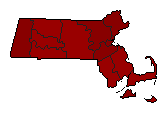 |  | State Auditor |
1,935,905 |
1 |
0 |
0 |
1,189,725 |
61.46% |
80.62% |
0.00% |
0.00% |
19.38% |
1,560,782 |
0 |
0 |
375,123 |
| | | Map | Pie | Initiative | Total Vote | N | | Y | Margin | %Margin | No | | Yes | Oth. | No | | Yes | |
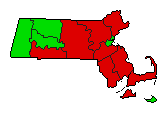 | | Initiative |
1,993,770 |
1 |
0 |
2 |
90,736 |
4.55% |
52.28% |
0.00% |
47.72% |
0.00% |
1,042,253 |
0 |
951,517 |
0 |
|


