Note: The Google advertisement links below may advocate political positions that this site does not endorse.
| Map | Pie | Office | Total | D | R | I | Margin | %Margin | Dem | Rep | Ind | Oth. | Dem | Rep | Ind | Other | | | | | | | | | | | | | | | | | | |
|---|
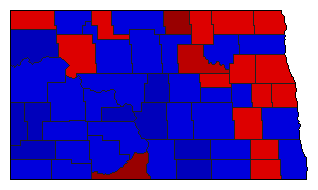
 |  | Senator |
218,152 |
1 |
2 |
4 |
85,729 |
39.30% |
68.83% |
29.53% |
0.64% |
1.01% |
150,146 |
64,417 |
1,395 |
2,194 |
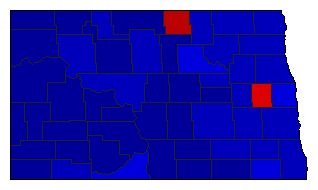
 | | Secretary of State |
213,924 |
2 |
1 |
0 |
16,758 |
7.83% |
46.08% |
53.92% |
0.00% |
0.00% |
98,583 |
115,341 |
0 |
0 |
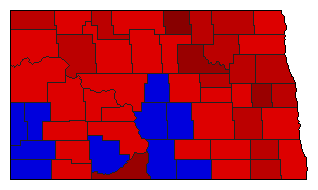
 | | Attorney General |
215,226 |
2 |
1 |
0 |
81,162 |
37.71% |
31.14% |
68.86% |
0.00% |
0.00% |
67,032 |
148,194 |
0 |
0 |
 |  | Agriculture Commissioner |
214,548 |
1 |
2 |
0 |
25,076 |
11.69% |
55.84% |
44.16% |
0.00% |
0.00% |
119,812 |
94,736 |
0 |
0 |
| | | Map | Pie | Initiative | Total Vote | N | | Y | Margin | %Margin | No | | Yes | Oth. | No | | Yes | |
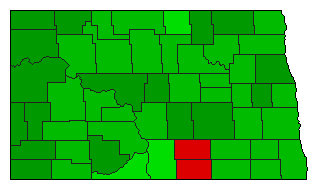 | | Referendum |
203,962 |
2 |
0 |
1 |
71,358 |
34.99% |
32.51% |
0.00% |
67.49% |
0.00% |
66,302 |
0 |
137,660 |
0 |
|
