| Map | Pie | Year | Total | D | R | I | Margin | %Margin | Dem | Rep | Ind | Oth. | Dem | Rep | Ind | Other | | | | | | | | | | | | | | | | | | |
|---|
|  | 2022 |
1,256,789 |
0 |
1 |
0 |
1,189,371 |
94.64% |
0.00% |
97.32% |
0.00% |
2.68% |
0 |
1,223,080 |
0 |
33,709 |
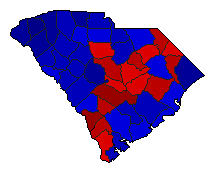
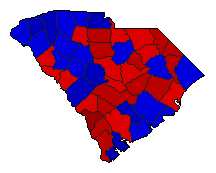
 |  | 2018 |
1,703,834 |
2 |
1 |
0 |
173,226 |
10.17% |
44.89% |
55.05% |
0.00% |
0.06% |
764,806 |
938,032 |
0 |
996 |
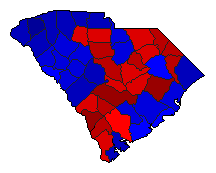
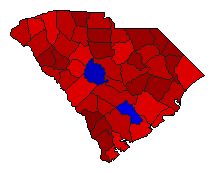
 | | 2014 |
1,225,371 |
2 |
1 |
0 |
252,376 |
20.60% |
39.67% |
60.26% |
0.00% |
0.07% |
486,058 |
738,434 |
0 |
879 |
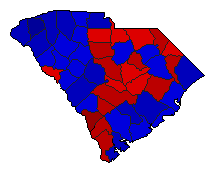
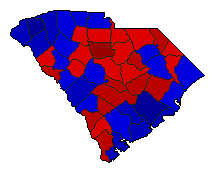
 | | 2010 |
1,332,806 |
2 |
1 |
0 |
127,058 |
9.53% |
44.20% |
53.74% |
0.00% |
2.06% |
589,135 |
716,193 |
0 |
27,478 |
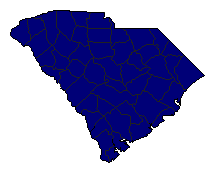 | | 2006 |
785,546 |
0 |
1 |
0 |
773,360 |
98.45% |
0.00% |
99.22% |
0.00% |
0.78% |
0 |
779,453 |
0 |
6,093 |
 | | 2002 |
1,084,989 |
2 |
1 |
0 |
119,371 |
11.00% |
44.48% |
55.48% |
0.00% |
0.05% |
482,560 |
601,931 |
0 |
498 |
 | | 1998 |
1,051,591 |
2 |
1 |
0 |
83,798 |
7.97% |
45.99% |
53.96% |
0.00% |
0.05% |
483,608 |
567,406 |
0 |
577 |
 | | 1994 |
907,490 |
2 |
1 |
0 |
94,805 |
10.45% |
44.76% |
55.21% |
0.00% |
0.03% |
406,184 |
500,989 |
0 |
317 |
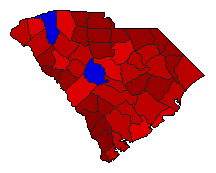
 | | 1982 |
656,178 |
1 |
2 |
0 |
139,185 |
21.21% |
60.60% |
39.39% |
0.00% |
0.01% |
397,642 |
258,457 |
0 |
79 |
 | | 1974 |
507,945 |
1 |
2 |
3 |
116,561 |
22.95% |
60.91% |
37.96% |
1.13% |
0.00% |
309,394 |
192,833 |
5,718 |
0 |
|
