| Map | Pie | Office | Total | D | R | I | Margin | %Margin | Dem | Rep | Ind | Oth. | Dem | Rep | Ind | Other | | | | | | | | | | | | | | | | | | |
|---|
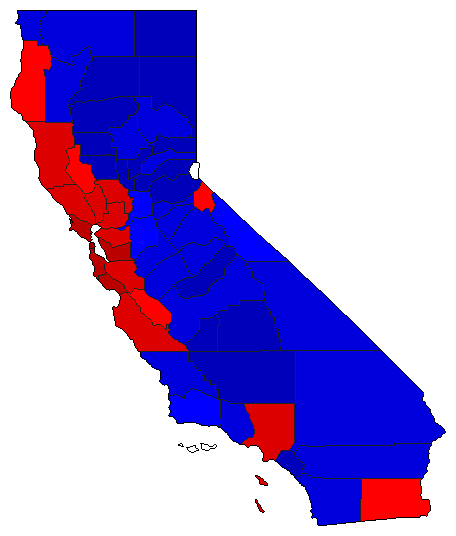
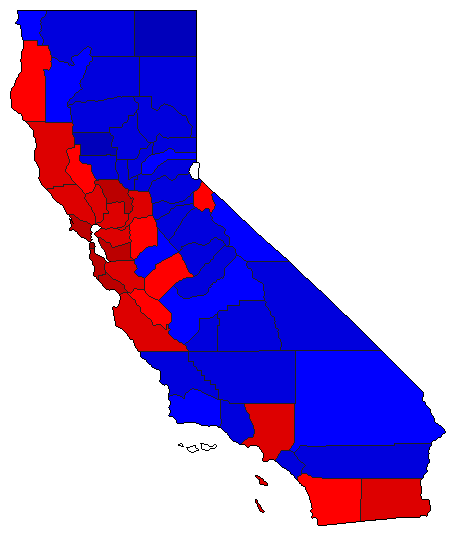
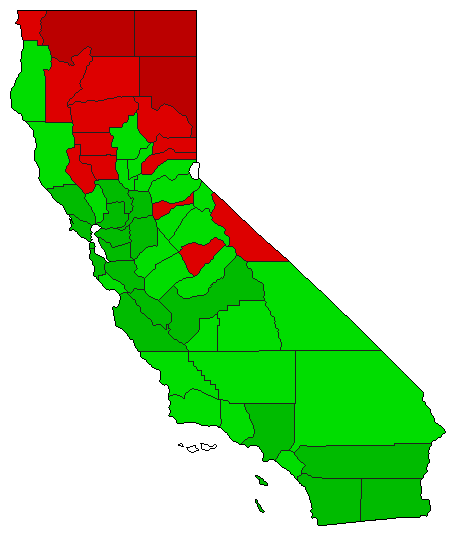
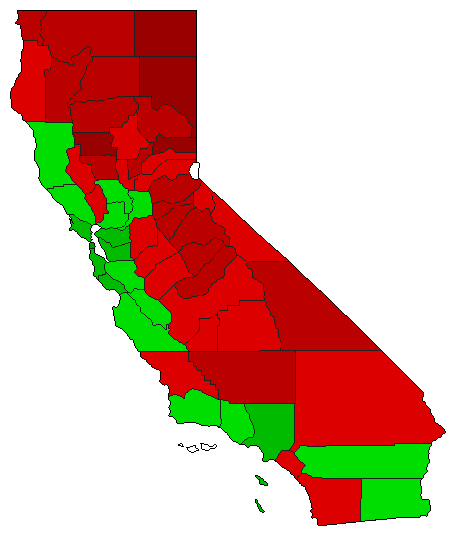
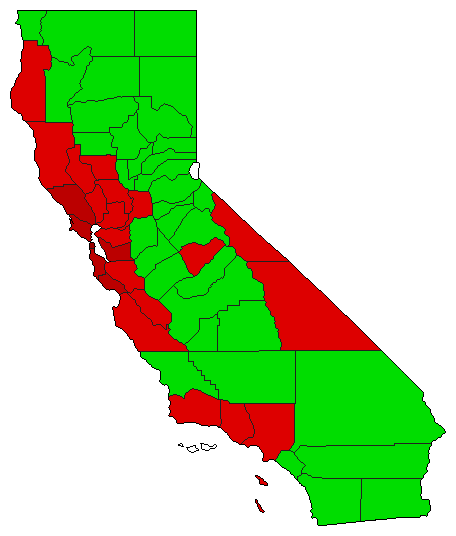
 |  | Senator |
8,541,476 |
1 |
2 |
0 |
2,085,467 |
24.42% |
59.43% |
35.02% |
0.00% |
5.55% |
5,076,289 |
2,990,822 |
0 |
474,365 |
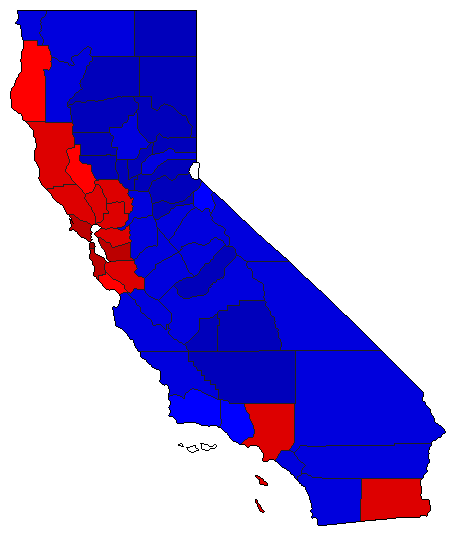
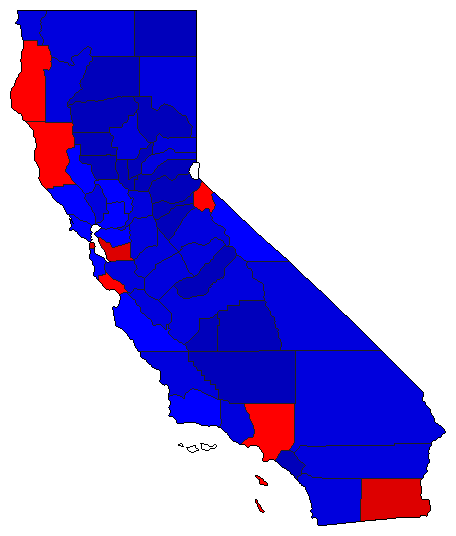
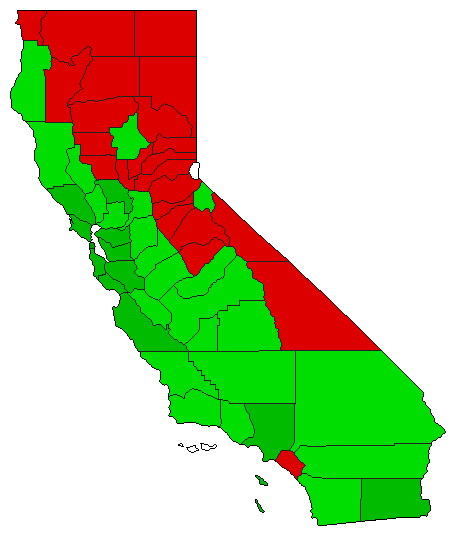
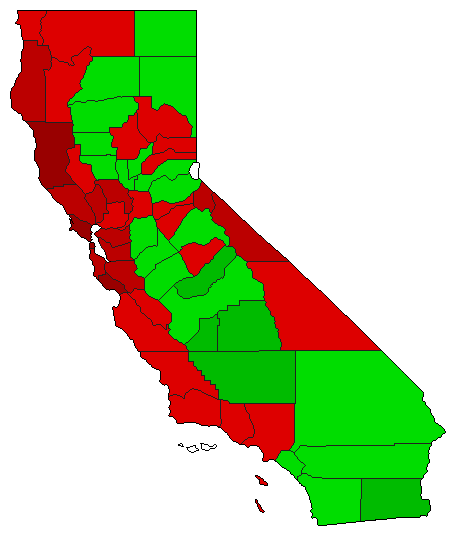
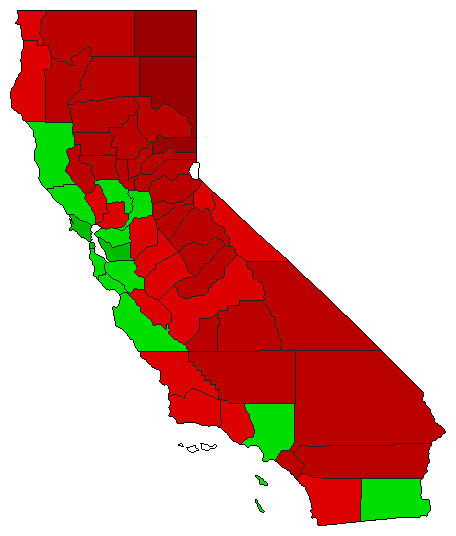
 |  | Governor |
8,679,416 |
2 |
1 |
0 |
1,473,425 |
16.98% |
38.91% |
55.88% |
0.00% |
5.21% |
3,376,732 |
4,850,157 |
0 |
452,527 |
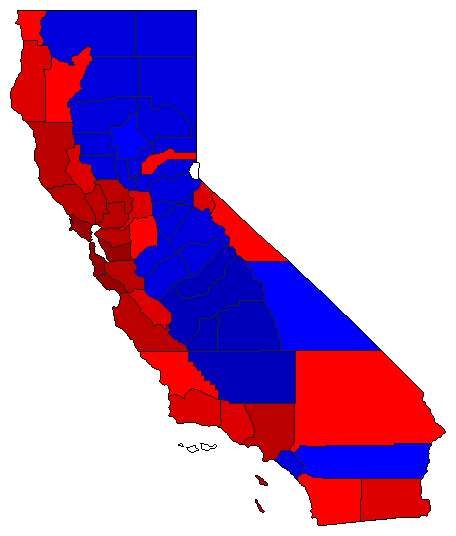
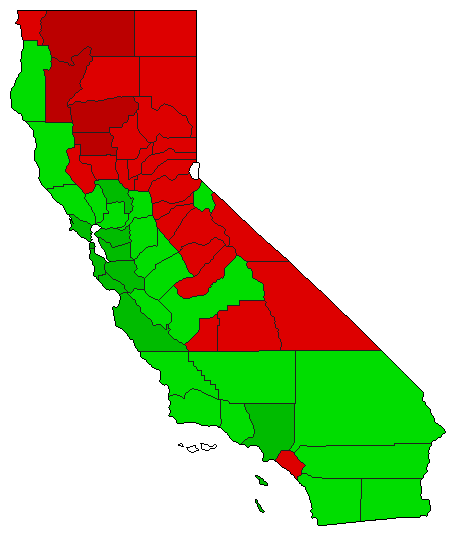
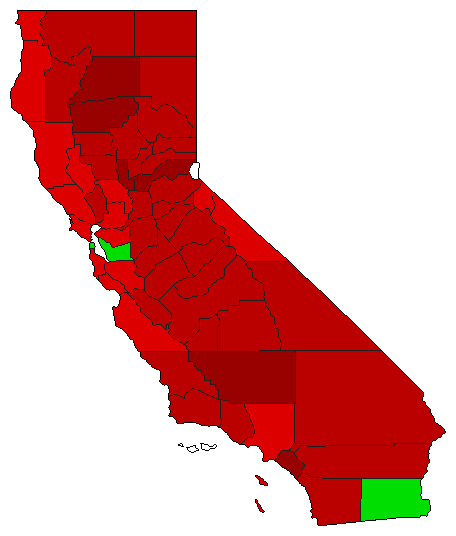
 | | Lt. Governor |
8,529,165 |
1 |
2 |
0 |
343,726 |
4.03% |
49.12% |
45.09% |
0.00% |
5.79% |
4,189,584 |
3,845,858 |
0 |
493,723 |
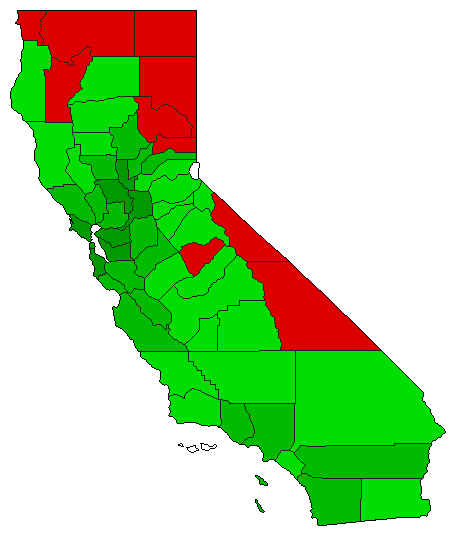
 | | Secretary of State |
8,385,573 |
1 |
2 |
0 |
259,602 |
3.10% |
48.09% |
44.99% |
0.00% |
6.92% |
4,032,553 |
3,772,951 |
0 |
580,069 |
 | | State Treasurer |
8,320,201 |
1 |
2 |
0 |
1,428,239 |
17.17% |
54.37% |
37.21% |
0.00% |
8.42% |
4,523,854 |
3,095,615 |
0 |
700,732 |
 | | Attorney General |
8,449,009 |
1 |
2 |
0 |
1,535,755 |
18.18% |
56.29% |
38.12% |
0.00% |
5.59% |
4,756,184 |
3,220,429 |
0 |
472,396 |
 | | Controller |
8,361,049 |
1 |
2 |
0 |
871,702 |
10.43% |
50.62% |
40.19% |
0.00% |
9.19% |
4,232,313 |
3,360,611 |
0 |
768,125 |
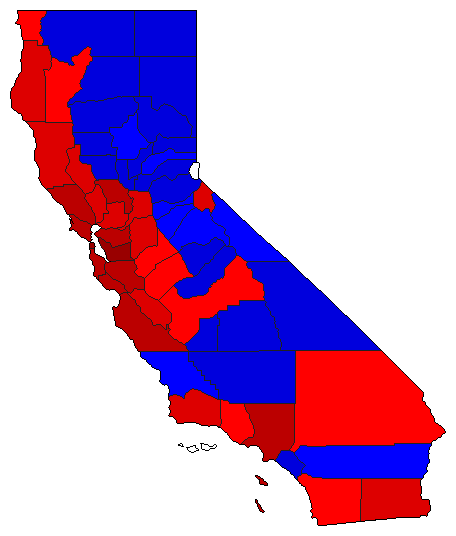
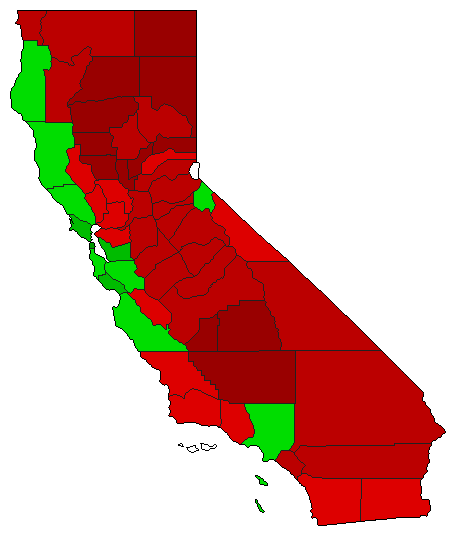
 | | Insurance Commissioner |
8,329,397 |
2 |
1 |
0 |
1,029,450 |
12.36% |
38.47% |
50.83% |
0.00% |
10.70% |
3,204,536 |
4,233,986 |
0 |
890,875 |
| | | Map | Pie | Initiative | Total Vote | N | | Y | Margin | %Margin | No | | Yes | Oth. | No | | Yes | |
 | | Referendum |
5,896,653 |
2 |
0 |
1 |
2,894,287 |
49.08% |
25.46% |
0.00% |
74.54% |
0.00% |
1,501,183 |
0 |
4,395,470 |
0 |
 | | Referendum |
5,787,885 |
2 |
0 |
1 |
2,820,867 |
48.74% |
25.63% |
0.00% |
74.37% |
0.00% |
1,483,509 |
0 |
4,304,376 |
0 |
 | | Initiative |
8,317,512 |
2 |
0 |
1 |
4,483,662 |
53.91% |
23.05% |
0.00% |
76.95% |
0.00% |
1,916,925 |
0 |
6,400,587 |
0 |
 | | Initiative |
8,330,799 |
2 |
0 |
1 |
1,893,485 |
22.73% |
38.64% |
0.00% |
61.36% |
0.00% |
3,218,657 |
0 |
5,112,142 |
0 |
 | | Initiative |
8,335,905 |
2 |
0 |
1 |
1,293,795 |
15.52% |
42.24% |
0.00% |
57.76% |
0.00% |
3,521,055 |
0 |
4,814,850 |
0 |
 | | Initiative |
8,356,923 |
2 |
0 |
1 |
1,152,813 |
13.79% |
43.10% |
0.00% |
56.90% |
0.00% |
3,602,055 |
0 |
4,754,868 |
0 |
 | | Initiative |
8,268,398 |
2 |
0 |
1 |
2,343,306 |
28.34% |
35.83% |
0.00% |
64.17% |
0.00% |
2,962,546 |
0 |
5,305,852 |
0 |
 | | Initiative |
8,410,397 |
2 |
0 |
1 |
3,443,203 |
40.94% |
29.53% |
0.00% |
70.47% |
0.00% |
2,483,597 |
0 |
5,926,800 |
0 |
 | | Initiative |
8,238,950 |
2 |
0 |
1 |
624,940 |
7.59% |
46.21% |
0.00% |
53.79% |
0.00% |
3,807,005 |
0 |
4,431,945 |
0 |
 | | Initiative |
8,444,842 |
1 |
0 |
2 |
707,414 |
8.38% |
54.19% |
0.00% |
45.81% |
0.00% |
4,576,128 |
0 |
3,868,714 |
0 |
 | | Initiative |
8,562,047 |
1 |
0 |
2 |
289,331 |
3.38% |
51.69% |
0.00% |
48.31% |
0.00% |
4,425,689 |
0 |
4,136,358 |
0 |
 | | Initiative |
8,496,482 |
1 |
0 |
2 |
774,048 |
9.11% |
54.56% |
0.00% |
45.44% |
0.00% |
4,635,265 |
0 |
3,861,217 |
0 |
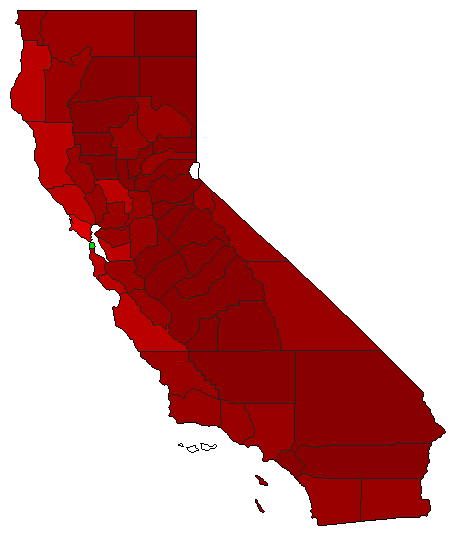
 | | Initiative |
8,344,268 |
1 |
0 |
2 |
4,449,644 |
53.33% |
76.66% |
0.00% |
23.34% |
0.00% |
6,396,956 |
0 |
1,947,312 |
0 |
 | | Initiative |
8,257,346 |
1 |
0 |
2 |
4,007,890 |
48.54% |
74.27% |
0.00% |
25.73% |
0.00% |
6,132,618 |
0 |
2,124,728 |
0 |
 | | Initiative |
8,256,765 |
1 |
0 |
2 |
392,679 |
4.76% |
52.38% |
0.00% |
47.62% |
0.00% |
4,324,722 |
0 |
3,932,043 |
0 |
 | | Initiative |
4,917,259 |
1 |
0 |
2 |
264,649 |
5.38% |
52.69% |
0.00% |
47.31% |
0.00% |
2,590,954 |
0 |
2,326,305 |
0 |
 | | Initiative |
4,994,417 |
1 |
0 |
2 |
1,078,017 |
21.58% |
60.79% |
0.00% |
39.21% |
0.00% |
3,036,217 |
0 |
1,958,200 |
0 |
|
