| Map | Pie | Office | Total | D | R | I | Margin | %Margin | Dem | Rep | Ind | Oth. | Dem | Rep | Ind | Other | | | | | | | | | | | | | | | | | | |
|---|
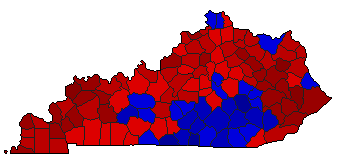
 |  | Governor |
1,055,325 |
1 |
2 |
0 |
183,779 |
17.41% |
58.71% |
41.29% |
0.00% |
0.00% |
619,552 |
435,773 |
0 |
0 |
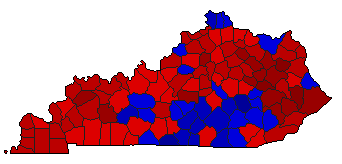
 | | Secretary of State |
1,011,053 |
2 |
1 |
0 |
142,703 |
14.11% |
42.94% |
57.06% |
0.00% |
0.00% |
434,175 |
576,878 |
0 |
0 |
 | | State Treasurer |
998,202 |
1 |
2 |
0 |
149,578 |
14.98% |
57.49% |
42.51% |
0.00% |
0.00% |
573,890 |
424,312 |
0 |
0 |
 | | Attorney General |
1,012,292 |
1 |
2 |
0 |
213,086 |
21.05% |
60.52% |
39.48% |
0.00% |
0.00% |
612,689 |
399,603 |
0 |
0 |
 | | State Auditor |
1,000,527 |
1 |
2 |
0 |
183,293 |
18.32% |
59.16% |
40.84% |
0.00% |
0.00% |
591,910 |
408,617 |
0 |
0 |
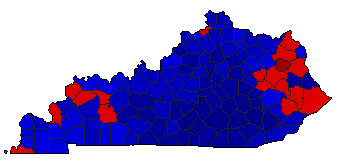 | | Agriculture Commissioner |
1,006,375 |
2 |
1 |
0 |
281,697 |
27.99% |
36.00% |
64.00% |
0.00% |
0.00% |
362,339 |
644,036 |
0 |
0 |
|
