| Map | Pie | Year | Total | D | R | I | Margin | %Margin | Dem | Rep | Ind | Oth. | Dem | Rep | Ind | Other | | | | | | | | | | | | | | | | | | |
|---|
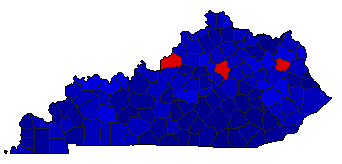
|  | 2023 |
1,285,138 |
2 |
1 |
0 |
186,061 |
14.48% |
42.76% |
57.23% |
0.00% |
0.01% |
549,461 |
735,522 |
0 |
155 |
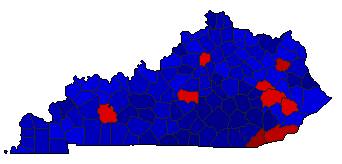
 |  | 2019 |
1,411,409 |
2 |
1 |
0 |
300,891 |
21.32% |
39.34% |
60.66% |
0.00% |
0.00% |
555,259 |
856,150 |
0 |
0 |
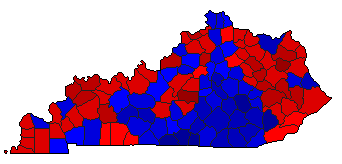
 |  | 2015 |
943,869 |
2 |
1 |
0 |
200,723 |
21.27% |
39.37% |
60.63% |
0.00% |
0.00% |
371,573 |
572,296 |
0 |
0 |
 | | 2011 |
806,590 |
1 |
2 |
0 |
17,497 |
2.17% |
48.77% |
46.61% |
0.00% |
4.62% |
393,413 |
375,916 |
0 |
37,261 |
 | | 2007 |
998,202 |
1 |
2 |
0 |
149,578 |
14.98% |
57.49% |
42.51% |
0.00% |
0.00% |
573,890 |
424,312 |
0 |
0 |
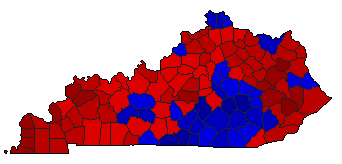
 | | 2003 |
1,006,129 |
1 |
2 |
0 |
131,927 |
13.11% |
56.56% |
43.44% |
0.00% |
0.00% |
569,028 |
437,101 |
0 |
0 |
 | | 1995 |
904,163 |
1 |
2 |
0 |
85,439 |
9.45% |
54.72% |
45.28% |
0.00% |
0.00% |
494,801 |
409,362 |
0 |
0 |
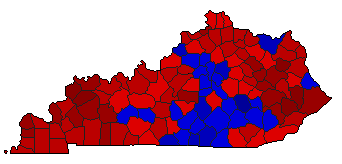 | | 1991 |
718,426 |
1 |
2 |
0 |
95,912 |
13.35% |
56.68% |
43.32% |
0.00% |
0.00% |
407,169 |
311,257 |
0 |
0 |
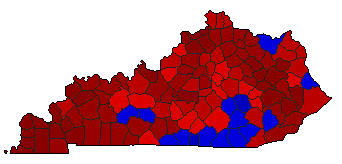 | | 1987 |
637,474 |
1 |
2 |
0 |
208,611 |
32.72% |
66.35% |
33.63% |
0.00% |
0.02% |
422,977 |
214,366 |
0 |
131 |
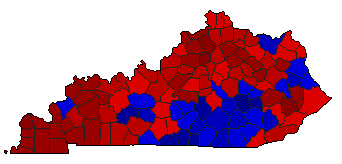
 | | 1983 |
811,048 |
1 |
2 |
0 |
162,930 |
20.09% |
60.04% |
39.96% |
0.00% |
0.00% |
486,989 |
324,059 |
0 |
0 |
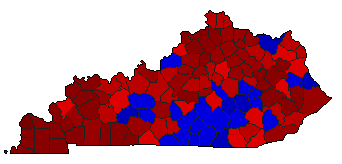
 | | 1979 |
756,397 |
1 |
2 |
0 |
141,249 |
18.67% |
59.34% |
40.66% |
0.00% |
0.00% |
448,823 |
307,574 |
0 |
0 |
 | | 1975 |
626,187 |
1 |
2 |
0 |
148,159 |
23.66% |
61.83% |
38.17% |
0.00% |
0.00% |
387,173 |
239,014 |
0 |
0 |
|