| Map | Pie | Office | Total | D | R | I | Margin | %Margin | Dem | Rep | Ind | Oth. | Dem | Rep | Ind | Other | | | | | | | | | | | | | | | | | | |
|---|
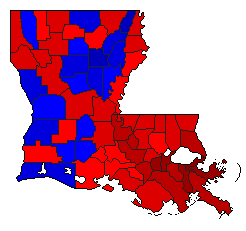
 |  | Governor |
1,297,840 |
2 |
1 |
3 |
472,799 |
36.43% |
17.45% |
53.88% |
14.38% |
14.29% |
226,476 |
699,275 |
186,682 |
185,407 |
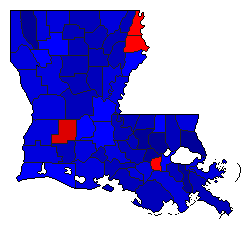
 | | Lt. Governor |
1,231,196 |
1 |
2 |
3 |
323,321 |
26.26% |
56.60% |
30.34% |
10.51% |
2.55% |
696,899 |
373,578 |
129,363 |
31,356 |
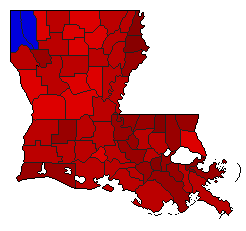
 | | Secretary of State |
1,196,816 |
2 |
1 |
3 |
384,200 |
32.10% |
31.25% |
63.35% |
5.41% |
0.00% |
373,956 |
758,156 |
64,704 |
0 |
 | | Attorney General |
717,059 |
1 |
2 |
0 |
238,089 |
33.20% |
66.60% |
33.40% |
0.00% |
0.00% |
477,574 |
239,485 |
0 |
0 |
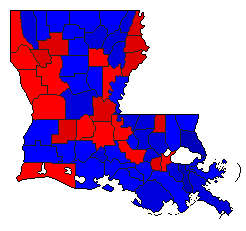 | | Insurance Commissioner |
1,191,637 |
2 |
1 |
3 |
182,812 |
15.34% |
35.56% |
50.90% |
8.89% |
4.65% |
423,722 |
606,534 |
105,981 |
55,400 |
|
