| Map | Pie | Office | Total | D | R | I | Margin | %Margin | Dem | Rep | Ind | Oth. | Dem | Rep | Ind | Other | | | | | | | | | | | | | | | | | | |
|---|
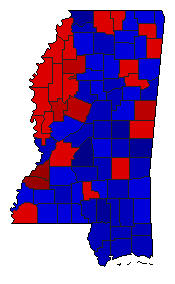
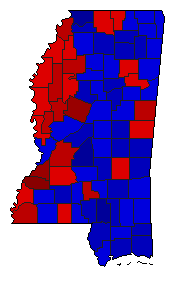
 |  | Governor |
744,039 |
2 |
1 |
0 |
117,575 |
15.80% |
42.10% |
57.90% |
0.00% |
0.00% |
313,232 |
430,807 |
0 |
0 |
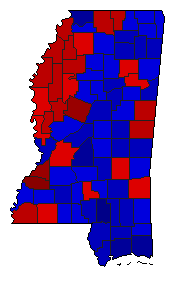
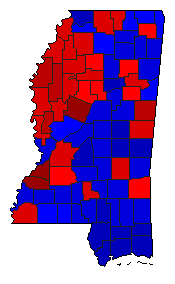
 | | Lt. Governor |
737,156 |
2 |
1 |
0 |
126,338 |
17.14% |
41.43% |
58.57% |
0.00% |
0.00% |
305,409 |
431,747 |
0 |
0 |
 | | Secretary of State |
730,146 |
2 |
1 |
0 |
120,310 |
16.48% |
41.76% |
58.24% |
0.00% |
0.00% |
304,918 |
425,228 |
0 |
0 |
 | | State Treasurer |
721,622 |
2 |
1 |
0 |
152,044 |
21.07% |
39.47% |
60.53% |
0.00% |
0.00% |
284,789 |
436,833 |
0 |
0 |
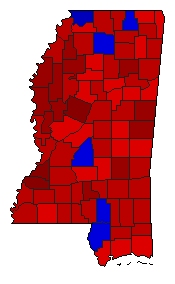 | | Attorney General |
735,533 |
1 |
2 |
0 |
144,501 |
19.65% |
59.82% |
40.18% |
0.00% |
0.00% |
440,017 |
295,516 |
0 |
0 |
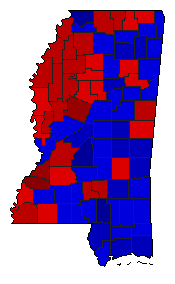 | | State Auditor |
726,312 |
2 |
1 |
0 |
72,246 |
9.95% |
45.03% |
54.97% |
0.00% |
0.00% |
327,033 |
399,279 |
0 |
0 |
 | | Insurance Commissioner |
734,005 |
2 |
1 |
0 |
95,431 |
13.00% |
43.50% |
56.50% |
0.00% |
0.00% |
319,287 |
414,718 |
0 |
0 |
 | | Agriculture Commissioner |
727,531 |
2 |
1 |
0 |
62,498 |
8.59% |
42.43% |
51.02% |
0.00% |
6.55% |
308,693 |
371,191 |
0 |
47,647 |
|
