| Map | Pie | Office | Total | D | R | I | Margin | %Margin | Dem | Rep | Ind | Oth. | Dem | Rep | Ind | Other | | | | | | | | | | | | | | | | | | |
|---|
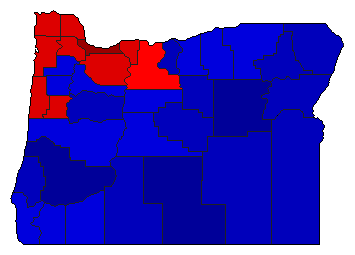
 |  | President |
1,827,864 |
1 |
2 |
- |
298,816 |
16.35% |
56.75% |
40.40% |
0.00% |
2.85% |
1,037,291 |
738,475 |
0 |
52,098 |
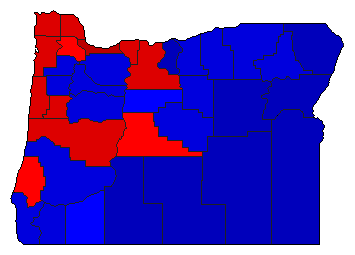
 |  | Senator |
1,767,504 |
1 |
2 |
0 |
59,233 |
3.35% |
48.90% |
45.55% |
0.00% |
5.54% |
864,392 |
805,159 |
0 |
97,953 |
 | | Secretary of State |
1,707,948 |
1 |
2 |
3 |
87,773 |
5.14% |
51.00% |
45.86% |
2.99% |
0.15% |
871,039 |
783,266 |
51,004 |
2,639 |
 | | State Treasurer |
1,653,606 |
1 |
2 |
0 |
96,833 |
5.86% |
51.12% |
45.26% |
0.00% |
3.62% |
845,330 |
748,497 |
0 |
59,779 |
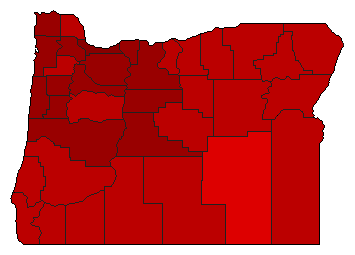 | | Attorney General |
1,510,931 |
1 |
0 |
0 |
927,641 |
61.40% |
72.57% |
0.00% |
0.00% |
27.43% |
1,096,507 |
0 |
0 |
414,424 |
| | | Map | Pie | Initiative | Total Vote | N | | Y | Margin | %Margin | No | | Yes | Oth. | No | | Yes | |
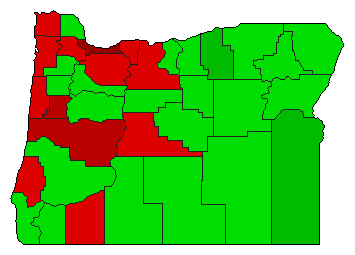 | | Referendum |
1,734,599 |
1 |
0 |
2 |
220,793 |
12.73% |
56.36% |
0.00% |
43.64% |
0.00% |
977,696 |
0 |
756,903 |
0 |
|
