2008 General Election Results Comparison - Pennsylvania
| Map | Pie | Office | Total | D | R | I | Margin | %Margin | Dem | Rep | Ind | Oth. | Dem | Rep | Ind | Other |
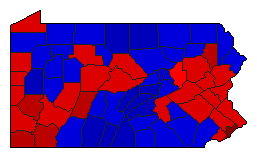
 |  | President | 6,015,476 | 1 | 2 | - | 620,478 | 10.31% | 54.47% | 44.15% | 0.00% | 1.38% | 3,276,363 | 2,655,885 | 0 | 83,228 |
 | State Treasurer | 5,646,598 | 1 | 2 | 0 | 681,634 | 12.07% | 54.98% | 42.90% | 0.00% | 2.12% | 3,104,242 | 2,422,608 | 0 | 119,748 | |
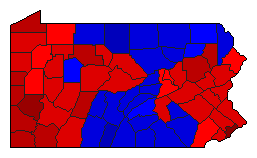
 | Attorney General | 5,732,574 | 2 | 1 | 0 | 383,136 | 6.68% | 45.70% | 52.38% | 0.00% | 1.92% | 2,619,791 | 3,002,927 | 0 | 109,856 | |
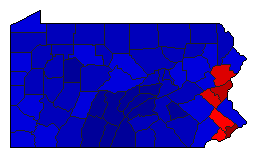
 | State Auditor | 5,654,791 | 1 | 2 | 0 | 1,201,676 | 21.25% | 59.00% | 37.75% | 0.00% | 3.25% | 3,336,219 | 2,134,543 | 0 | 184,029 |
Pennsylvania Results for 2008
Login
© Dave Leip's Atlas of U.S. Elections, LLC 2019 All Rights Reserved
Note: The advertisement links below may advocate political positions that this site does not endorse.
Login
© Dave Leip's Atlas of U.S. Elections, LLC 2019 All Rights Reserved
Note: The advertisement links below may advocate political positions that this site does not endorse.