| Map | Pie | Office | Total | D | R | I | Margin | %Margin | Dem | Rep | Ind | Oth. | Dem | Rep | Ind | Other | | | | | | | | | | | | | | | | | | |
|---|
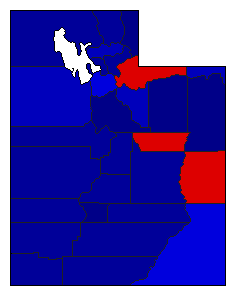
 |  | President |
958,996 |
2 |
1 |
- |
268,360 |
27.98% |
34.17% |
62.15% |
0.00% |
3.68% |
327,670 |
596,030 |
0 |
35,296 |
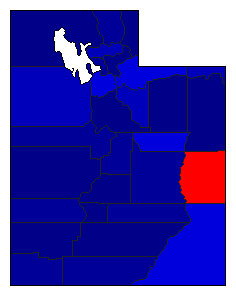
 |  | Governor |
945,525 |
2 |
1 |
0 |
547,546 |
57.91% |
19.72% |
77.63% |
0.00% |
2.64% |
186,503 |
734,049 |
0 |
24,973 |
 | | State Treasurer |
906,338 |
2 |
1 |
0 |
301,844 |
33.30% |
33.35% |
66.65% |
0.00% |
0.00% |
302,247 |
604,091 |
0 |
0 |
 | | Attorney General |
937,870 |
2 |
1 |
0 |
400,655 |
42.72% |
26.60% |
69.32% |
0.00% |
4.08% |
249,492 |
650,147 |
0 |
38,231 |
 | | State Auditor |
902,590 |
2 |
1 |
0 |
241,964 |
26.81% |
31.62% |
58.43% |
0.00% |
9.95% |
285,417 |
527,381 |
0 |
89,792 |
| | | Map | Pie | Initiative | Total Vote | N | | Y | Margin | %Margin | No | | Yes | Oth. | No | | Yes | |
 | | Referendum |
865,691 |
2 |
0 |
1 |
447,721 |
51.72% |
24.14% |
0.00% |
75.86% |
0.00% |
208,985 |
0 |
656,706 |
0 |
 | | Referendum |
855,531 |
2 |
0 |
1 |
272,817 |
31.89% |
34.06% |
0.00% |
65.94% |
0.00% |
291,357 |
0 |
564,174 |
0 |
 | | Referendum |
862,372 |
2 |
0 |
1 |
353,606 |
41.00% |
29.50% |
0.00% |
70.50% |
0.00% |
254,383 |
0 |
607,989 |
0 |
 | | Referendum |
847,475 |
2 |
0 |
1 |
478,629 |
56.48% |
21.76% |
0.00% |
78.24% |
0.00% |
184,423 |
0 |
663,052 |
0 |
 | | Referendum |
863,630 |
1 |
0 |
2 |
115,326 |
13.35% |
56.68% |
0.00% |
43.32% |
0.00% |
489,478 |
0 |
374,152 |
0 |
|
