Note: The Google advertisement links below may advocate political positions that this site does not endorse.
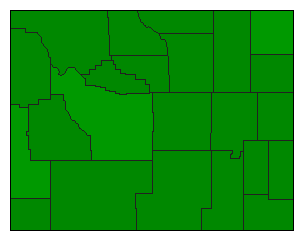
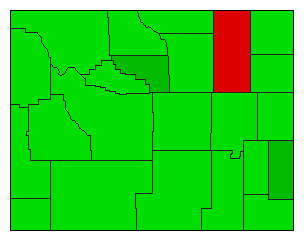
| Map | Pie | Office | Total | D | R | I | Margin | %Margin | Dem | Rep | Ind | Oth. | Dem | Rep | Ind | Other | | | | | | | | | | | | | | | | | | |
|---|
 |  | President |
254,658 |
2 |
1 |
- |
82,090 |
32.24% |
32.54% |
64.78% |
0.00% |
2.68% |
82,868 |
164,958 |
0 |
6,832 |
 |  | Senator |
249,946 |
2 |
1 |
0 |
128,415 |
51.38% |
24.26% |
75.63% |
0.00% |
0.11% |
60,631 |
189,046 |
0 |
269 |
 |  | Senator (S) |
249,558 |
2 |
1 |
0 |
116,861 |
46.83% |
26.53% |
73.35% |
0.00% |
0.12% |
66,202 |
183,063 |
0 |
293 |
| | | Map | Pie | Initiative | Total Vote | N | | Y | Margin | %Margin | No | | Yes | Oth. | No | | Yes | |
 | | Referendum |
234,608 |
2 |
0 |
1 |
148,966 |
63.50% |
18.25% |
0.00% |
81.75% |
0.00% |
42,821 |
0 |
191,787 |
0 |
 | | Referendum |
221,988 |
2 |
0 |
1 |
18,678 |
8.41% |
45.79% |
0.00% |
54.21% |
0.00% |
101,655 |
0 |
120,333 |
0 |
|