| Map | Pie | Office | Total | D | R | I | Margin | %Margin | Dem | Rep | Ind | Oth. | Dem | Rep | Ind | Other | | | | | | | | | | | | | | | | | | |
|---|
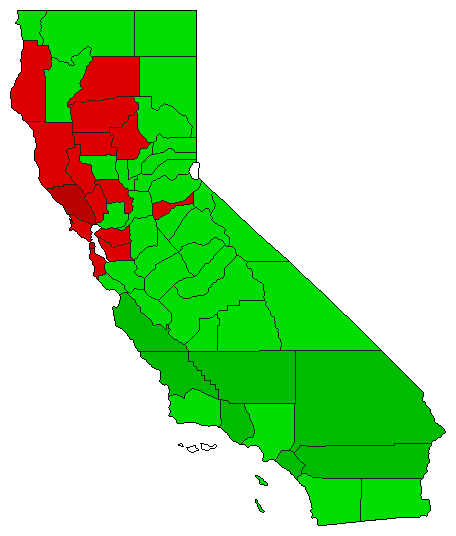
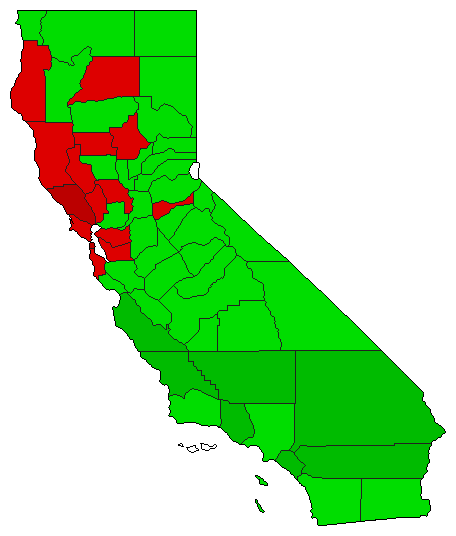
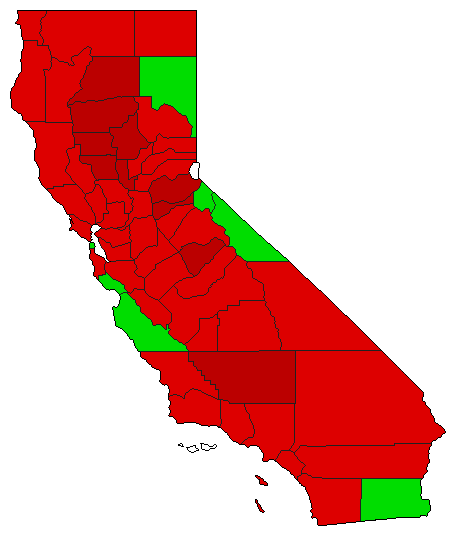
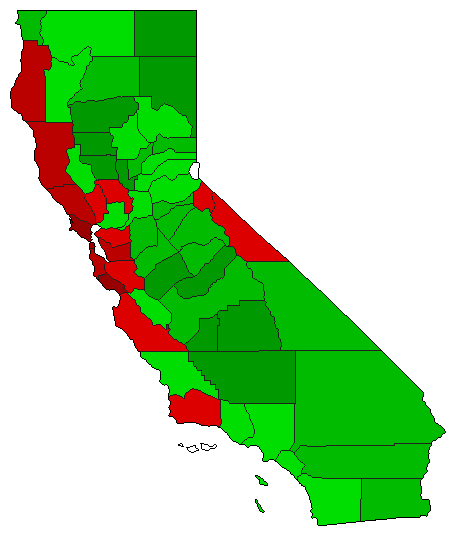
 |  | President |
13,583,083 |
1 |
2 |
- |
3,262,692 |
24.02% |
60.92% |
36.90% |
0.00% |
2.19% |
8,274,473 |
5,011,781 |
0 |
296,829 |
| | | Map | Pie | Initiative | Total Vote | N | | Y | Margin | %Margin | No | | Yes | Oth. | No | | Yes | |
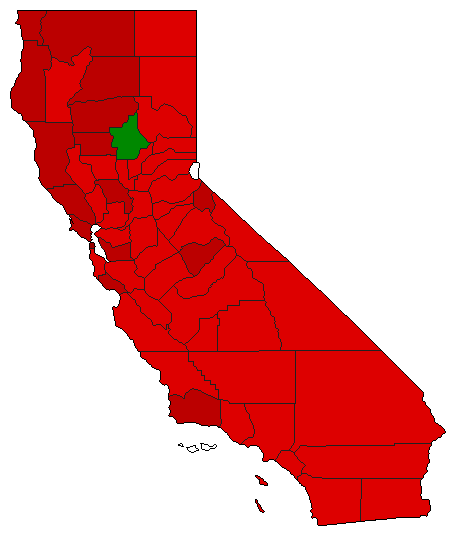
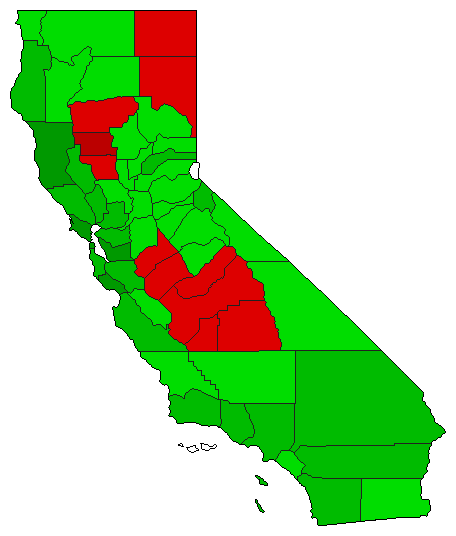
 | | Referendum |
6,916,139 |
2 |
0 |
1 |
814,803 |
11.78% |
44.11% |
0.00% |
55.89% |
0.00% |
3,050,668 |
0 |
3,865,471 |
0 |
 | | Referendum |
6,906,907 |
2 |
0 |
1 |
818,709 |
11.85% |
44.07% |
0.00% |
55.93% |
0.00% |
3,044,099 |
0 |
3,862,808 |
0 |
 | | Referendum |
6,890,759 |
2 |
0 |
1 |
797,063 |
11.57% |
44.22% |
0.00% |
55.78% |
0.00% |
3,046,848 |
0 |
3,843,911 |
0 |
 | | Referendum |
6,887,534 |
2 |
0 |
1 |
802,588 |
11.65% |
44.17% |
0.00% |
55.83% |
0.00% |
3,042,473 |
0 |
3,845,061 |
0 |
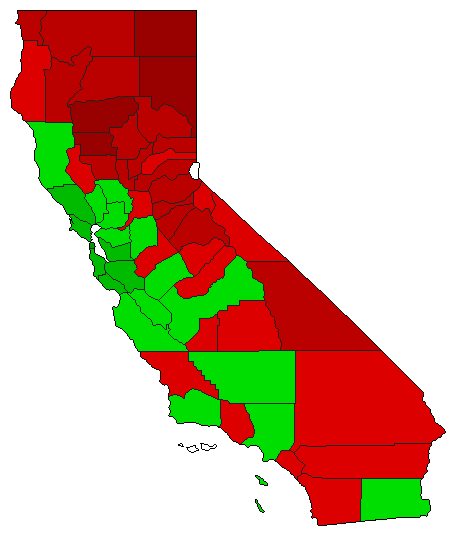
 | | Initiative |
6,547,077 |
1 |
0 |
2 |
1,050,119 |
16.04% |
58.02% |
0.00% |
41.98% |
0.00% |
3,798,598 |
0 |
2,748,479 |
0 |
 | | Initiative |
6,744,968 |
1 |
0 |
2 |
971,758 |
14.41% |
57.20% |
0.00% |
42.80% |
0.00% |
3,858,363 |
0 |
2,886,605 |
0 |
 | | Initiative |
6,819,479 |
1 |
0 |
2 |
485,911 |
7.13% |
53.56% |
0.00% |
46.44% |
0.00% |
3,652,695 |
0 |
3,166,784 |
0 |
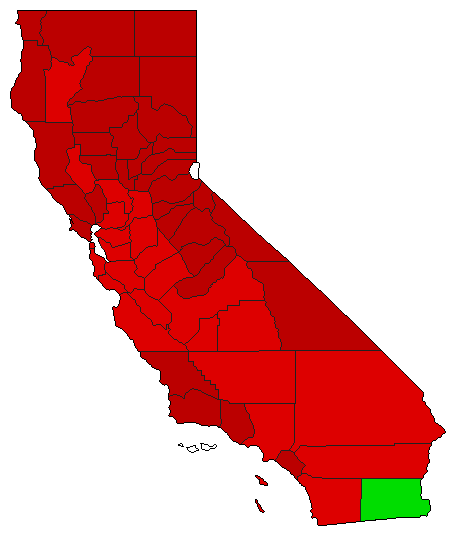
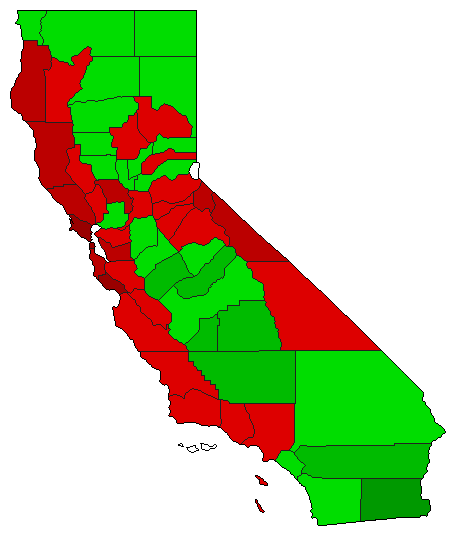
 | | Initiative |
12,935,507 |
2 |
0 |
1 |
3,472,031 |
26.84% |
36.58% |
0.00% |
63.42% |
0.00% |
4,731,738 |
0 |
8,203,769 |
0 |
 | | Initiative |
12,696,429 |
2 |
0 |
1 |
664,541 |
5.23% |
47.38% |
0.00% |
52.62% |
0.00% |
6,015,944 |
0 |
6,680,485 |
0 |
 | | Initiative |
12,948,951 |
1 |
0 |
2 |
508,005 |
3.92% |
51.96% |
0.00% |
48.04% |
0.00% |
6,728,478 |
0 |
6,220,473 |
0 |
 | | Initiative |
13,402,626 |
2 |
0 |
1 |
599,662 |
4.47% |
47.76% |
0.00% |
52.24% |
0.00% |
6,401,482 |
0 |
7,001,144 |
0 |
|
