| Map | Pie | Year | Total | D | R | I | Margin | %Margin | Dem | Rep | Ind | Oth. | Dem | Rep | Ind | Other | | | | | | | | | | | | | | | | | | |
|---|
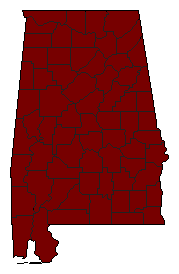
|  | 2022 |
1,130,825 |
0 |
1 |
0 |
771,902 |
68.26% |
0.00% |
83.74% |
0.00% |
16.26% |
0 |
946,936 |
0 |
183,889 |
 | | 2014 |
764,100 |
0 |
1 |
0 |
733,652 |
96.02% |
0.00% |
98.01% |
0.00% |
1.99% |
0 |
748,876 |
0 |
15,224 |
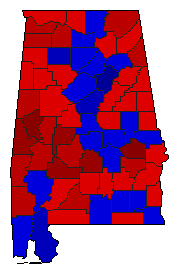
 | | 2010 |
1,457,895 |
2 |
1 |
0 |
296,465 |
20.34% |
39.83% |
60.17% |
0.00% |
0.00% |
580,715 |
877,180 |
0 |
0 |
 | | 2006 |
1,197,161 |
2 |
1 |
0 |
253,291 |
21.16% |
39.39% |
60.55% |
0.00% |
0.06% |
471,570 |
724,861 |
0 |
730 |
 | | 2002 |
1,301,716 |
2 |
1 |
0 |
51,329 |
3.94% |
46.83% |
50.77% |
0.00% |
2.40% |
609,544 |
660,873 |
0 |
31,299 |
 | | 1998 |
1,254,647 |
1 |
2 |
0 |
366,845 |
29.24% |
64.62% |
35.38% |
0.00% |
0.00% |
810,746 |
443,901 |
0 |
0 |
 | | 1994 |
1,123,434 |
1 |
2 |
0 |
32 |
0.00% |
50.00% |
50.00% |
0.00% |
0.00% |
561,733 |
561,701 |
0 |
0 |
 |  | 1990 |
770,507 |
1 |
0 |
0 |
770,507 |
100.00% |
100.00% |
0.00% |
0.00% |
0.00% |
770,507 |
0 |
0 |
0 |
 |  | 1986 |
718,512 |
1 |
0 |
0 |
718,512 |
100.00% |
100.00% |
0.00% |
0.00% |
0.00% |
718,512 |
0 |
0 |
0 |
|
