| Map | Pie | Year | Total | D | R | I | Margin | %Margin | Dem | Rep | Ind | Oth. | Dem | Rep | Ind | Other | | | | | | | | | | | | | | | | | | |
|---|
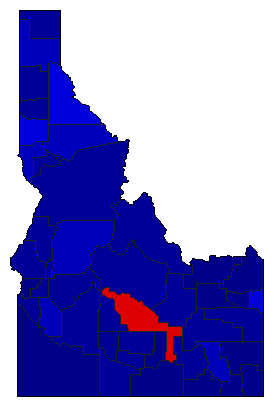
|  | 2022 |
582,605 |
2 |
1 |
0 |
248,843 |
42.71% |
26.82% |
69.53% |
0.00% |
3.66% |
156,232 |
405,075 |
0 |
21,298 |
 |  | 2018 |
465,105 |
0 |
1 |
0 |
465,105 |
100.00% |
0.00% |
100.00% |
0.00% |
0.00% |
0 |
465,105 |
0 |
0 |
 | | 2014 |
342,013 |
0 |
1 |
0 |
342,013 |
100.00% |
0.00% |
100.00% |
0.00% |
0.00% |
0 |
342,013 |
0 |
0 |
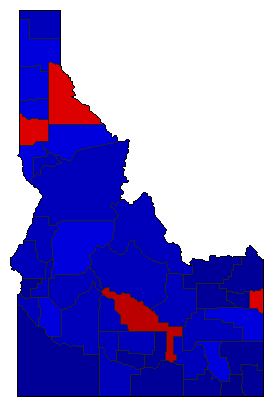
 | | 2010 |
433,778 |
2 |
1 |
0 |
182,636 |
42.10% |
28.95% |
71.05% |
0.00% |
0.00% |
125,571 |
308,207 |
0 |
0 |
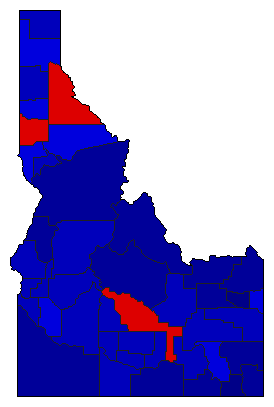
 | | 2006 |
433,591 |
2 |
1 |
0 |
73,969 |
17.06% |
41.47% |
58.53% |
0.00% |
0.00% |
179,811 |
253,780 |
0 |
0 |
 | | 2002 |
390,367 |
2 |
1 |
0 |
112,619 |
28.85% |
33.18% |
62.03% |
0.00% |
4.78% |
129,542 |
242,161 |
0 |
18,664 |
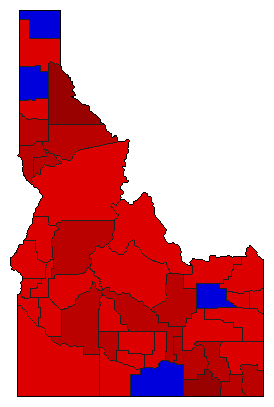 | | 1998 |
371,855 |
1 |
2 |
0 |
50,717 |
13.64% |
56.82% |
43.18% |
0.00% |
0.00% |
211,286 |
160,569 |
0 |
0 |
|
