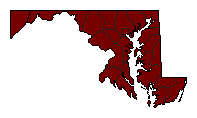
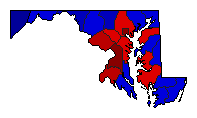
| Map | Pie | Office | Total | D | R | I | Margin | %Margin | Dem | Rep | Ind | Oth. | Dem | Rep | Ind | Other | | | | | | | | | | | | | | | | | | |
|---|
 |  | Senator |
1,833,858 |
1 |
2 |
0 |
484,865 |
26.44% |
62.19% |
35.75% |
0.00% |
2.05% |
1,140,531 |
655,666 |
0 |
37,661 |
 |  | Governor |
1,857,880 |
1 |
2 |
0 |
268,642 |
14.46% |
56.24% |
41.79% |
0.00% |
1.97% |
1,044,961 |
776,319 |
0 |
36,600 |
 | | Attorney General |
1,374,995 |
1 |
0 |
0 |
1,324,929 |
96.36% |
98.18% |
0.00% |
0.00% |
1.82% |
1,349,962 |
0 |
0 |
25,033 |
 | | Comptroller General |
1,781,096 |
1 |
2 |
0 |
396,375 |
22.25% |
61.08% |
38.82% |
0.00% |
0.10% |
1,087,836 |
691,461 |
0 |
1,799 |
|