| Map | Pie | Office | Total | D | R | I | Margin | %Margin | Dem | Rep | Ind | Oth. | Dem | Rep | Ind | Other | | | | | | | | | | | | | | | | | | |
|---|
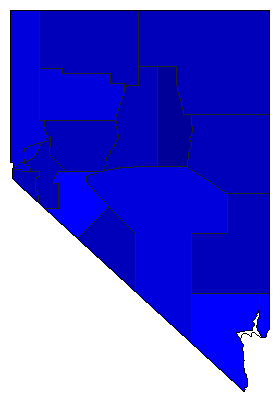
 |  | Senator |
721,404 |
1 |
2 |
7 |
41,424 |
5.74% |
50.29% |
44.55% |
0.44% |
4.72% |
362,785 |
321,361 |
3,175 |
34,083 |
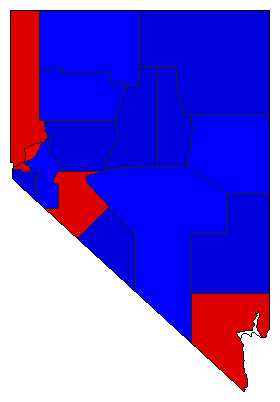
 |  | Governor |
716,529 |
2 |
1 |
4 |
84,179 |
11.75% |
41.61% |
53.36% |
0.89% |
4.13% |
298,171 |
382,350 |
6,403 |
29,605 |
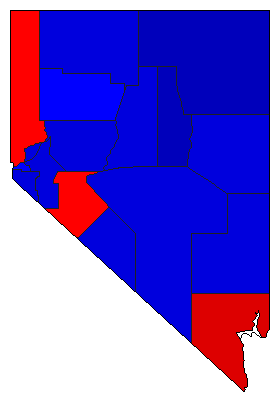
 | | Lt. Governor |
703,495 |
2 |
1 |
0 |
66,026 |
9.39% |
41.87% |
51.26% |
0.00% |
6.87% |
294,564 |
360,590 |
0 |
48,341 |
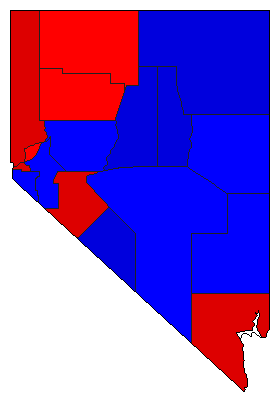
 | | Secretary of State |
703,513 |
1 |
2 |
0 |
111,864 |
15.90% |
53.17% |
37.27% |
0.00% |
9.55% |
374,086 |
262,222 |
0 |
67,205 |
 | | State Treasurer |
700,916 |
1 |
2 |
0 |
31,473 |
4.49% |
48.31% |
43.82% |
0.00% |
7.88% |
338,588 |
307,115 |
0 |
55,213 |
 | | Attorney General |
703,332 |
1 |
2 |
0 |
120,742 |
17.17% |
52.89% |
35.73% |
0.00% |
11.38% |
372,011 |
251,269 |
0 |
80,052 |
 | | Controller |
697,619 |
1 |
2 |
0 |
34,242 |
4.91% |
47.49% |
42.58% |
0.00% |
9.93% |
331,311 |
297,069 |
0 |
69,239 |
|
