Note: The Google advertisement links below may advocate political positions that this site does not endorse.
| Map | Pie | Office | Total | D | R | I | Margin | %Margin | Dem | Rep | Ind | Oth. | Dem | Rep | Ind | Other | | | | | | | | | | | | | | | | | | |
|---|
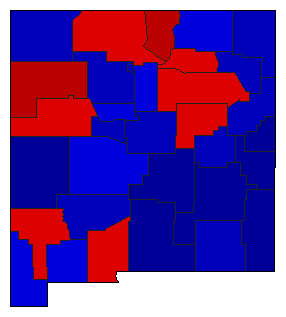
 |  | Governor |
602,826 |
2 |
1 |
0 |
40,605 |
6.74% |
46.55% |
53.29% |
0.00% |
0.16% |
280,614 |
321,219 |
0 |
993 |
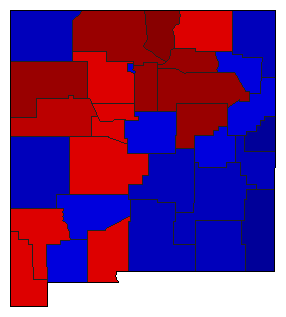
 |  | Secretary of State |
589,329 |
2 |
1 |
0 |
89,773 |
15.23% |
42.38% |
57.62% |
0.00% |
0.00% |
249,778 |
339,551 |
0 |
0 |
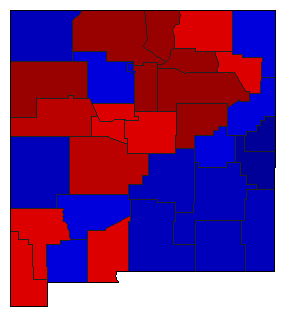
 | | State Treasurer |
580,536 |
1 |
2 |
0 |
60,588 |
10.44% |
55.22% |
44.78% |
0.00% |
0.00% |
320,562 |
259,974 |
0 |
0 |
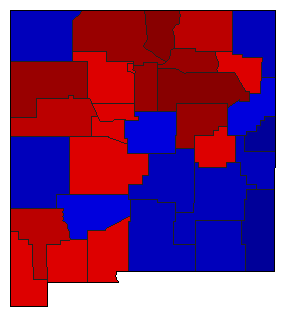
 |  | Attorney General |
592,778 |
1 |
2 |
0 |
42,268 |
7.13% |
53.57% |
46.43% |
0.00% |
0.00% |
317,523 |
275,255 |
0 |
0 |
 | | State Auditor |
580,598 |
1 |
2 |
0 |
58,080 |
10.00% |
55.00% |
45.00% |
0.00% |
0.00% |
319,339 |
261,259 |
0 |
0 |
|
