| Map | Pie | Office | Total | D | R | I | Margin | %Margin | Dem | Rep | Ind | Oth. | Dem | Rep | Ind | Other | | | | | | | | | | | | | | | | | | |
|---|
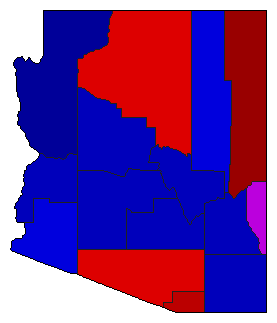
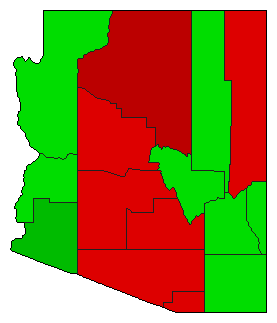
 |  | Senator |
1,713,334 |
2 |
1 |
5 |
413,604 |
24.14% |
34.55% |
58.69% |
0.35% |
6.41% |
592,011 |
1,005,615 |
5,938 |
109,770 |
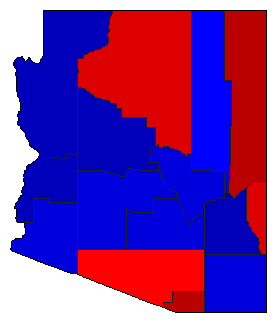
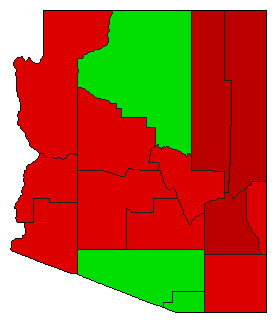
 |  | Governor |
1,729,736 |
2 |
1 |
0 |
204,999 |
11.85% |
42.43% |
54.28% |
0.00% |
3.29% |
733,935 |
938,934 |
0 |
56,867 |
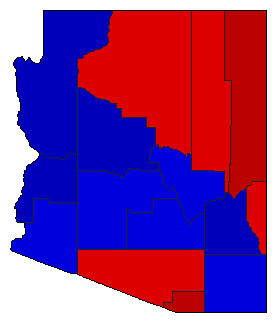
 | | Secretary of State |
1,661,065 |
2 |
1 |
0 |
272,803 |
16.42% |
41.79% |
58.21% |
0.00% |
0.00% |
694,131 |
966,934 |
0 |
0 |
 | | State Treasurer |
1,527,338 |
2 |
1 |
0 |
166,862 |
10.93% |
41.15% |
52.07% |
0.00% |
6.78% |
628,436 |
795,298 |
0 |
103,604 |
 | | Attorney General |
1,547,626 |
2 |
1 |
0 |
65,561 |
4.24% |
47.77% |
52.01% |
0.00% |
0.23% |
739,290 |
804,851 |
0 |
3,485 |
| | | Map | Pie | Initiative | Total Vote | N | | Y | Margin | %Margin | No | | Yes | Oth. | No | | Yes | |
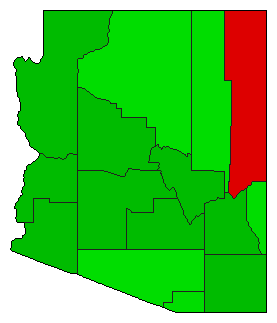 | | Referendum |
1,599,799 |
2 |
0 |
1 |
304,373 |
19.03% |
40.49% |
0.00% |
59.51% |
0.00% |
647,713 |
0 |
952,086 |
0 |
 | | Referendum |
1,641,135 |
1 |
0 |
2 |
212,847 |
12.97% |
56.48% |
0.00% |
43.52% |
0.00% |
926,991 |
0 |
714,144 |
0 |
 |  | Initiative |
1,678,356 |
2 |
0 |
1 |
4,340 |
0.26% |
49.87% |
0.00% |
50.13% |
0.00% |
837,008 |
0 |
841,348 |
0 |
 | | Initiative |
1,543,970 |
1 |
0 |
2 |
6,446 |
0.42% |
50.21% |
0.00% |
49.79% |
0.00% |
775,208 |
0 |
768,762 |
0 |
|
