| Map | Pie | Office | Total | D | R | I | Margin | %Margin | Dem | Rep | Ind | Oth. | Dem | Rep | Ind | Other | | | | | | | | | | | | | | | | | | |
|---|
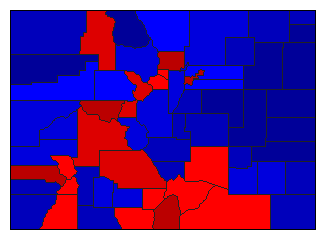
 |  | Senator |
1,777,668 |
1 |
2 |
6 |
29,896 |
1.68% |
48.08% |
46.40% |
0.64% |
4.89% |
854,685 |
824,789 |
11,351 |
86,843 |
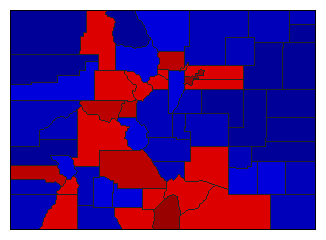
 |  | Governor |
1,793,148 |
1 |
3 |
5 |
263,060 |
14.67% |
51.05% |
11.14% |
0.48% |
37.33% |
915,436 |
199,792 |
8,601 |
669,319 |
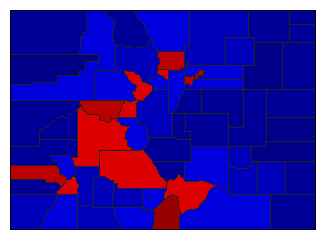
 | | Secretary of State |
1,717,065 |
2 |
1 |
0 |
97,753 |
5.69% |
43.85% |
49.54% |
0.00% |
6.61% |
752,915 |
850,668 |
0 |
113,482 |
 | | State Treasurer |
1,704,753 |
2 |
1 |
0 |
24,723 |
1.45% |
49.27% |
50.73% |
0.00% |
0.00% |
840,015 |
864,738 |
0 |
0 |
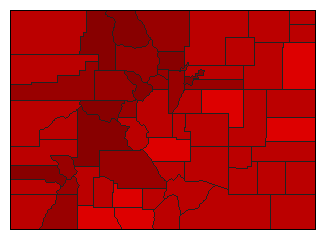
 | | Attorney General |
1,703,893 |
2 |
1 |
0 |
216,393 |
12.70% |
43.65% |
56.35% |
0.00% |
0.00% |
743,750 |
960,143 |
0 |
0 |
| | | Map | Pie | Initiative | Total Vote | N | | Y | Margin | %Margin | No | | Yes | Oth. | No | | Yes | |
 | | Initiative |
1,628,486 |
1 |
0 |
2 |
668,102 |
41.03% |
70.51% |
0.00% |
29.49% |
0.00% |
1,148,294 |
0 |
480,192 |
0 |
 | | Initiative |
1,609,491 |
1 |
0 |
2 |
96,511 |
6.00% |
53.00% |
0.00% |
47.00% |
0.00% |
853,001 |
0 |
756,490 |
0 |
|
