| Map | Pie | Office | Total | D | R | I | Margin | %Margin | Dem | Rep | Ind | Oth. | Dem | Rep | Ind | Other | | | | | | | | | | | | | | | | | | |
|---|
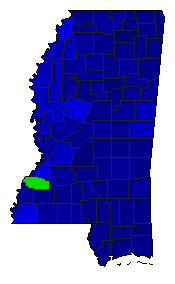
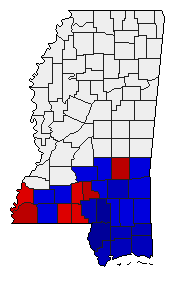
 |  | Governor |
891,952 |
2 |
1 |
0 |
196,636 |
22.05% |
38.98% |
61.02% |
0.00% |
0.00% |
347,658 |
544,294 |
0 |
0 |
 | | Lt. Governor |
801,626 |
0 |
1 |
2 |
486,332 |
60.67% |
0.00% |
80.33% |
19.67% |
0.00% |
0 |
643,979 |
157,647 |
0 |
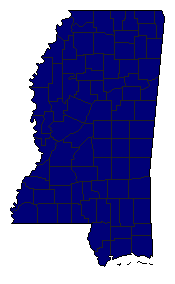 | | Secretary of State |
719,734 |
0 |
1 |
0 |
719,734 |
100.00% |
0.00% |
100.00% |
0.00% |
0.00% |
0 |
719,734 |
0 |
0 |
 | | State Treasurer |
872,271 |
2 |
1 |
0 |
180,075 |
20.64% |
38.17% |
58.82% |
0.00% |
3.01% |
332,953 |
513,028 |
0 |
26,290 |
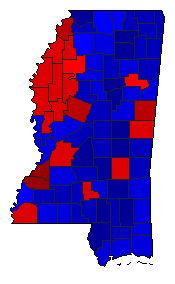
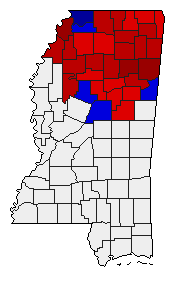
 | | Attorney General |
879,524 |
1 |
2 |
0 |
193,738 |
22.03% |
61.01% |
38.99% |
0.00% |
0.00% |
536,631 |
342,893 |
0 |
0 |
 | | State Auditor |
787,706 |
0 |
1 |
2 |
403,662 |
51.25% |
0.00% |
75.62% |
24.38% |
0.00% |
0 |
595,684 |
192,022 |
0 |
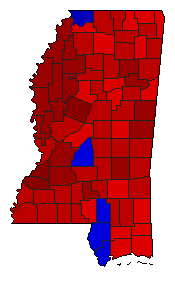
 | | Insurance Commissioner |
866,811 |
2 |
1 |
0 |
236,078 |
27.24% |
34.69% |
61.93% |
0.00% |
3.38% |
300,739 |
536,817 |
0 |
29,255 |
 | | Agriculture Commissioner |
866,977 |
2 |
1 |
3 |
141,204 |
16.29% |
40.63% |
56.91% |
2.46% |
0.00% |
352,213 |
493,417 |
21,347 |
0 |
| | | Map | Pie | Initiative | Total Vote | N | | Y | Margin | %Margin | No | | Yes | Oth. | No | | Yes | |
 | | Referendum |
279,328 |
2 |
1 |
0 |
36,022 |
12.90% |
43.55% |
56.45% |
0.00% |
0.00% |
121,653 |
157,675 |
0 |
0 |
 | | Referendum |
297,617 |
2 |
1 |
0 |
59,991 |
20.16% |
39.92% |
60.08% |
0.00% |
0.00% |
118,813 |
178,804 |
0 |
0 |
 | | Referendum |
288,656 |
1 |
2 |
0 |
33,542 |
11.62% |
55.81% |
44.19% |
0.00% |
0.00% |
161,099 |
127,557 |
0 |
0 |
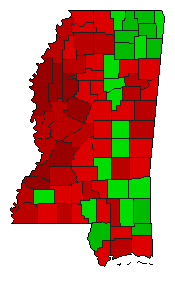 | | Initiative |
868,450 |
1 |
0 |
2 |
132,468 |
15.25% |
57.63% |
0.00% |
42.37% |
0.00% |
500,459 |
0 |
367,991 |
0 |
 | | Initiative |
867,761 |
2 |
0 |
1 |
209,551 |
24.15% |
37.93% |
0.00% |
62.07% |
0.00% |
329,105 |
0 |
538,656 |
0 |
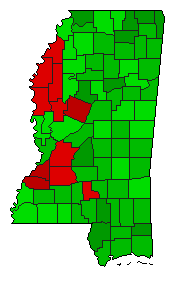
 | | Initiative |
873,938 |
2 |
0 |
1 |
403,116 |
46.13% |
26.94% |
0.00% |
73.06% |
0.00% |
235,411 |
0 |
638,527 |
0 |
|
