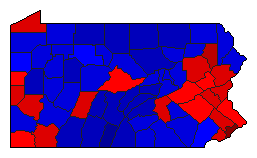
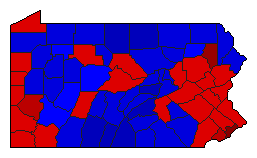
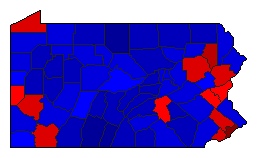
2012 General Election Results Comparison - Pennsylvania
Note: The Google advertisement links below may advocate political positions that this site does not endorse.
MapPieOfficeTotalDRIMargin%MarginDemRepIndOth.DemRepIndOther 
                 
MapMapPresident 5,755,620 1 2 - 309,840 5.38% 51.95% 46.57% 0.00% 1.48% 2,990,274 2,680,434 0 84,912
MapMapSenator 5,627,422 1 2 0 512,232 9.10% 53.69% 44.59% 0.00% 1.72% 3,021,364 2,509,132 0 96,926
MapState Treasurer 5,468,404 1 2 3 466,690 8.53% 52.53% 43.99% 3.48% 0.00% 2,872,344 2,405,654 190,406 0
MapAttorney General 5,567,203 1 2 3 812,051 14.59% 56.14% 41.56% 2.30% 0.00% 3,125,557 2,313,506 128,140 0
MapState Auditor 5,489,208 1 2 3 180,798 3.29% 49.73% 46.43% 3.84% 0.00% 2,729,565 2,548,767 210,876 0

Pennsylvania Results for 2012

Login

Terms of Use - DCMA Policy - Privacy Policy and Cookies


© Dave Leip's Atlas of U.S. Elections, LLC 2019 All Rights Reserved