2012 General Election Results Comparison - Washington
| Map | Pie | Office | Total | D | R | I | Margin | %Margin | Dem | Rep | Ind | Oth. | Dem | Rep | Ind | Other |
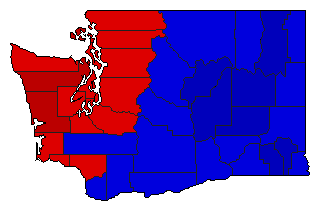
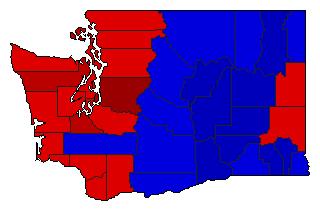
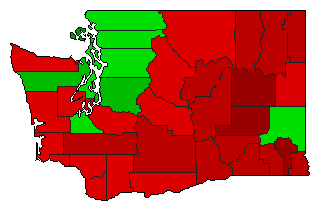
 |  | President | 3,145,958 | 1 | 2 | - | 464,726 | 14.77% | 55.80% | 41.03% | 0.00% | 3.18% | 1,755,396 | 1,290,670 | 0 | 99,892 |
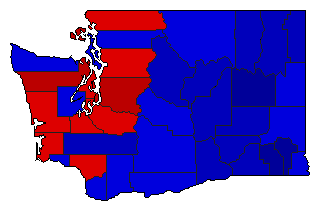
 |  | Senator | 3,069,417 | 1 | 2 | 0 | 641,569 | 20.90% | 60.45% | 39.55% | 0.00% | 0.00% | 1,855,493 | 1,213,924 | 0 | 0 |
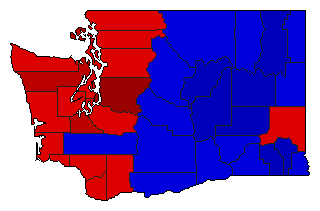
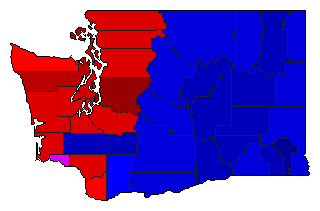
 |  | Governor | 3,071,047 | 1 | 2 | 0 | 94,557 | 3.08% | 51.54% | 48.46% | 0.00% | 0.00% | 1,582,802 | 1,488,245 | 0 | 0 |
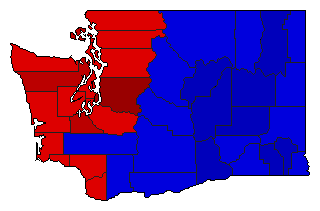
 |  | Lt. Governor | 2,934,343 | 1 | 2 | 0 | 215,923 | 7.36% | 53.68% | 46.32% | 0.00% | 0.00% | 1,575,133 | 1,359,210 | 0 | 0 |
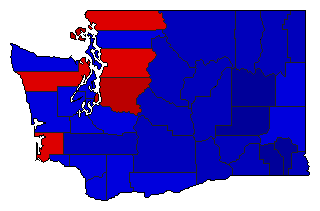 |  | Secretary of State | 2,907,607 | 2 | 1 | 0 | 21,871 | 0.75% | 49.62% | 50.38% | 0.00% | 0.00% | 1,442,868 | 1,464,739 | 0 | 0 |
 | State Treasurer | 2,887,551 | 1 | 2 | 0 | 503,251 | 17.43% | 58.71% | 41.29% | 0.00% | 0.00% | 1,695,401 | 1,192,150 | 0 | 0 | |
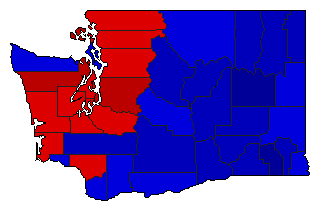 | Attorney General | 2,925,453 | 1 | 2 | 0 | 203,433 | 6.95% | 53.48% | 46.52% | 0.00% | 0.00% | 1,564,443 | 1,361,010 | 0 | 0 | |
 |  | Comptroller General | 2,880,494 | 1 | 2 | 0 | 503,672 | 17.49% | 58.74% | 41.26% | 0.00% | 0.00% | 1,692,083 | 1,188,411 | 0 | 0 |
 | State Auditor | 2,861,588 | 1 | 2 | 0 | 168,483 | 5.89% | 52.86% | 46.97% | 0.00% | 0.17% | 1,512,620 | 1,344,137 | 0 | 4,831 | |
 |  | Controller | 3,125,516 | 1 | 2 | 3 | 484,272 | 15.49% | 57.07% | 41.58% | 1.35% | 0.00% | 1,783,793 | 1,299,521 | 42,202 | 0 |
 | Insurance Commissioner | 2,851,481 | 1 | 2 | 0 | 473,629 | 16.61% | 58.30% | 41.70% | 0.00% | 0.00% | 1,662,555 | 1,188,926 | 0 | 0 | |
| Map | Pie | Initiative | Total Vote | N | Y | Margin | %Margin | No | Yes | Oth. | No | Yes | ||||
 |  | Referendum | 3,091,200 | 2 | 0 | 1 | 228,630 | 7.40% | 46.30% | 0.00% | 53.70% | 0.00% | 1,431,285 | 0 | 1,659,915 | 0 |
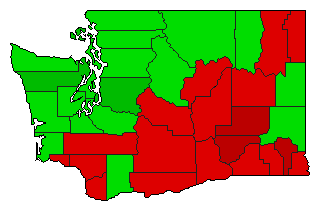 |  | Initiative | 3,095,444 | 2 | 0 | 1 | 352,974 | 11.40% | 44.30% | 0.00% | 55.70% | 0.00% | 1,371,235 | 0 | 1,724,209 | 0 |
Washington Results for 2012
Login
© Dave Leip's Atlas of U.S. Elections, LLC 2019 All Rights Reserved
Note: The advertisement links below may advocate political positions that this site does not endorse.
Login
© Dave Leip's Atlas of U.S. Elections, LLC 2019 All Rights Reserved
Note: The advertisement links below may advocate political positions that this site does not endorse.