| Map | Pie | Office | Total | D | R | I | Margin | %Margin | Dem | Rep | Ind | Oth. | Dem | Rep | Ind | Other | | | | | | | | | | | | | | | | | | |
|---|
 |  | Senator |
2,567,805 |
2 |
1 |
0 |
197,277 |
7.68% |
45.21% |
52.89% |
0.00% |
1.90% |
1,160,811 |
1,358,088 |
0 |
48,906 |
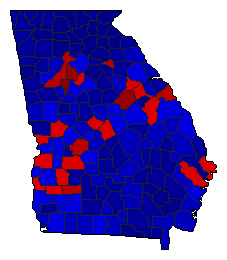
 |  | Governor |
2,550,648 |
2 |
1 |
0 |
200,443 |
7.86% |
44.88% |
52.74% |
0.00% |
2.38% |
1,144,794 |
1,345,237 |
0 |
60,617 |
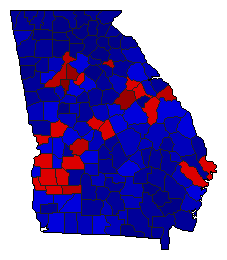
 | | Lt. Governor |
2,529,062 |
2 |
1 |
0 |
403,948 |
15.97% |
42.01% |
57.99% |
0.00% |
0.00% |
1,062,557 |
1,466,505 |
0 |
0 |
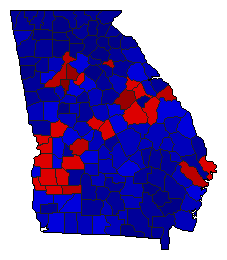
 | | Secretary of State |
2,527,655 |
2 |
1 |
0 |
377,453 |
14.93% |
42.53% |
57.47% |
0.00% |
0.00% |
1,075,101 |
1,452,554 |
0 |
0 |
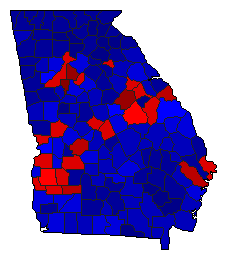
 | | Attorney General |
2,524,255 |
2 |
1 |
0 |
349,719 |
13.85% |
43.07% |
56.93% |
0.00% |
0.00% |
1,087,268 |
1,436,987 |
0 |
0 |
 | | Insurance Commissioner |
2,519,861 |
2 |
1 |
3 |
331,668 |
13.16% |
41.70% |
54.87% |
3.43% |
0.00% |
1,050,883 |
1,382,551 |
86,427 |
0 |
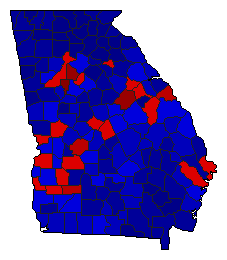 | | Agriculture Commissioner |
2,509,378 |
2 |
1 |
0 |
414,700 |
16.53% |
41.74% |
58.26% |
0.00% |
0.00% |
1,047,339 |
1,462,039 |
0 |
0 |
|