| Map | Pie | Office | Total | D | R | I | Margin | %Margin | Dem | Rep | Ind | Oth. | Dem | Rep | Ind | Other | | | | | | | | | | | | | | | | | | |
|---|
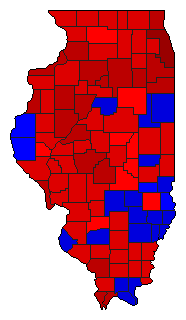
 |  | Senator |
3,603,519 |
1 |
2 |
0 |
391,115 |
10.85% |
53.55% |
42.69% |
0.00% |
3.76% |
1,929,637 |
1,538,522 |
0 |
135,360 |
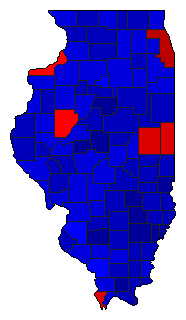
 |  | Governor |
3,627,690 |
2 |
1 |
0 |
142,284 |
3.92% |
46.35% |
50.27% |
0.00% |
3.38% |
1,681,343 |
1,823,627 |
0 |
122,720 |
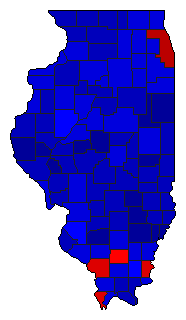
 | | Secretary of State |
3,614,608 |
1 |
2 |
3 |
1,240,397 |
34.32% |
65.70% |
31.39% |
2.89% |
0.02% |
2,374,849 |
1,134,452 |
104,498 |
809 |
 | | State Treasurer |
3,527,197 |
1 |
2 |
3 |
9,225 |
0.26% |
48.05% |
47.79% |
4.16% |
0.00% |
1,694,884 |
1,685,659 |
146,654 |
0 |
 | | Attorney General |
3,603,224 |
1 |
2 |
3 |
781,795 |
21.70% |
59.46% |
37.77% |
2.77% |
0.00% |
2,142,558 |
1,360,763 |
99,903 |
0 |
 | | Comptroller General |
3,583,286 |
2 |
1 |
3 |
139,390 |
3.89% |
45.67% |
49.56% |
4.76% |
0.00% |
1,636,593 |
1,775,983 |
170,534 |
176 |
| | | Map | Pie | Initiative | Total Vote | N | | Y | Margin | %Margin | No | | Yes | Oth. | No | | Yes | |
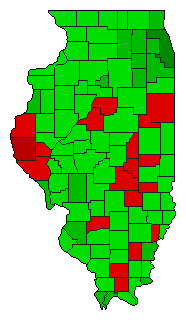 |  | Initiative |
3,504,697 |
2 |
0 |
1 |
1,173,649 |
33.49% |
33.26% |
0.00% |
66.74% |
0.00% |
1,165,524 |
0 |
2,339,173 |
0 |
 |  | Initiative |
3,499,038 |
2 |
0 |
1 |
1,125,164 |
32.16% |
33.92% |
0.00% |
66.08% |
0.00% |
1,186,937 |
0 |
2,312,101 |
0 |
 |  | Initiative |
3,456,675 |
2 |
0 |
1 |
943,391 |
27.29% |
36.35% |
0.00% |
63.65% |
0.00% |
1,256,642 |
0 |
2,200,033 |
0 |
|
