| Map | Pie | Office | Total | D | R | I | Margin | %Margin | Dem | Rep | Ind | Oth. | Dem | Rep | Ind | Other | | | | | | | | | | | | | | | | | | |
|---|
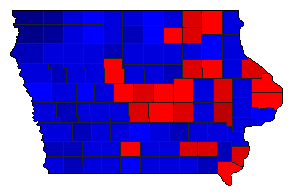
 |  | Senator |
1,129,700 |
2 |
1 |
3 |
94,205 |
8.34% |
43.76% |
52.10% |
2.37% |
1.77% |
494,370 |
588,575 |
26,815 |
19,940 |
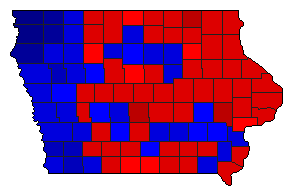
 |  | Governor |
1,131,258 |
2 |
1 |
0 |
245,700 |
21.72% |
37.27% |
58.99% |
0.00% |
3.74% |
421,625 |
667,325 |
0 |
42,308 |
 | | Secretary of State |
1,092,080 |
2 |
1 |
3 |
20,073 |
1.84% |
46.63% |
48.46% |
3.01% |
1.90% |
509,202 |
529,275 |
32,889 |
20,714 |
 | | State Treasurer |
1,091,190 |
1 |
2 |
3 |
100,309 |
9.19% |
52.87% |
43.68% |
3.39% |
0.06% |
576,942 |
476,633 |
36,945 |
670 |
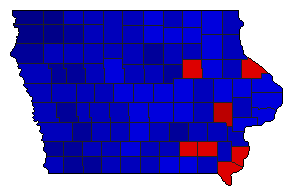
 | | Attorney General |
1,099,006 |
1 |
2 |
0 |
135,665 |
12.34% |
56.12% |
43.77% |
0.00% |
0.11% |
616,711 |
481,046 |
0 |
1,249 |
 | | State Auditor |
1,062,105 |
2 |
1 |
0 |
147,578 |
13.89% |
42.98% |
56.88% |
0.00% |
0.14% |
456,525 |
604,103 |
0 |
1,477 |
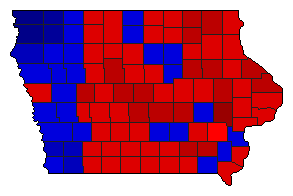
 | | Agriculture Commissioner |
1,086,230 |
2 |
1 |
3 |
305,572 |
28.13% |
34.08% |
62.21% |
3.62% |
0.08% |
370,209 |
675,781 |
39,349 |
891 |
|
